29
/
en
AIzaSyAYiBZKx7MnpbEhh9jyipgxe19OcubqV5w
April 1, 2024
123309
Ecuador
ECU
true
2
1
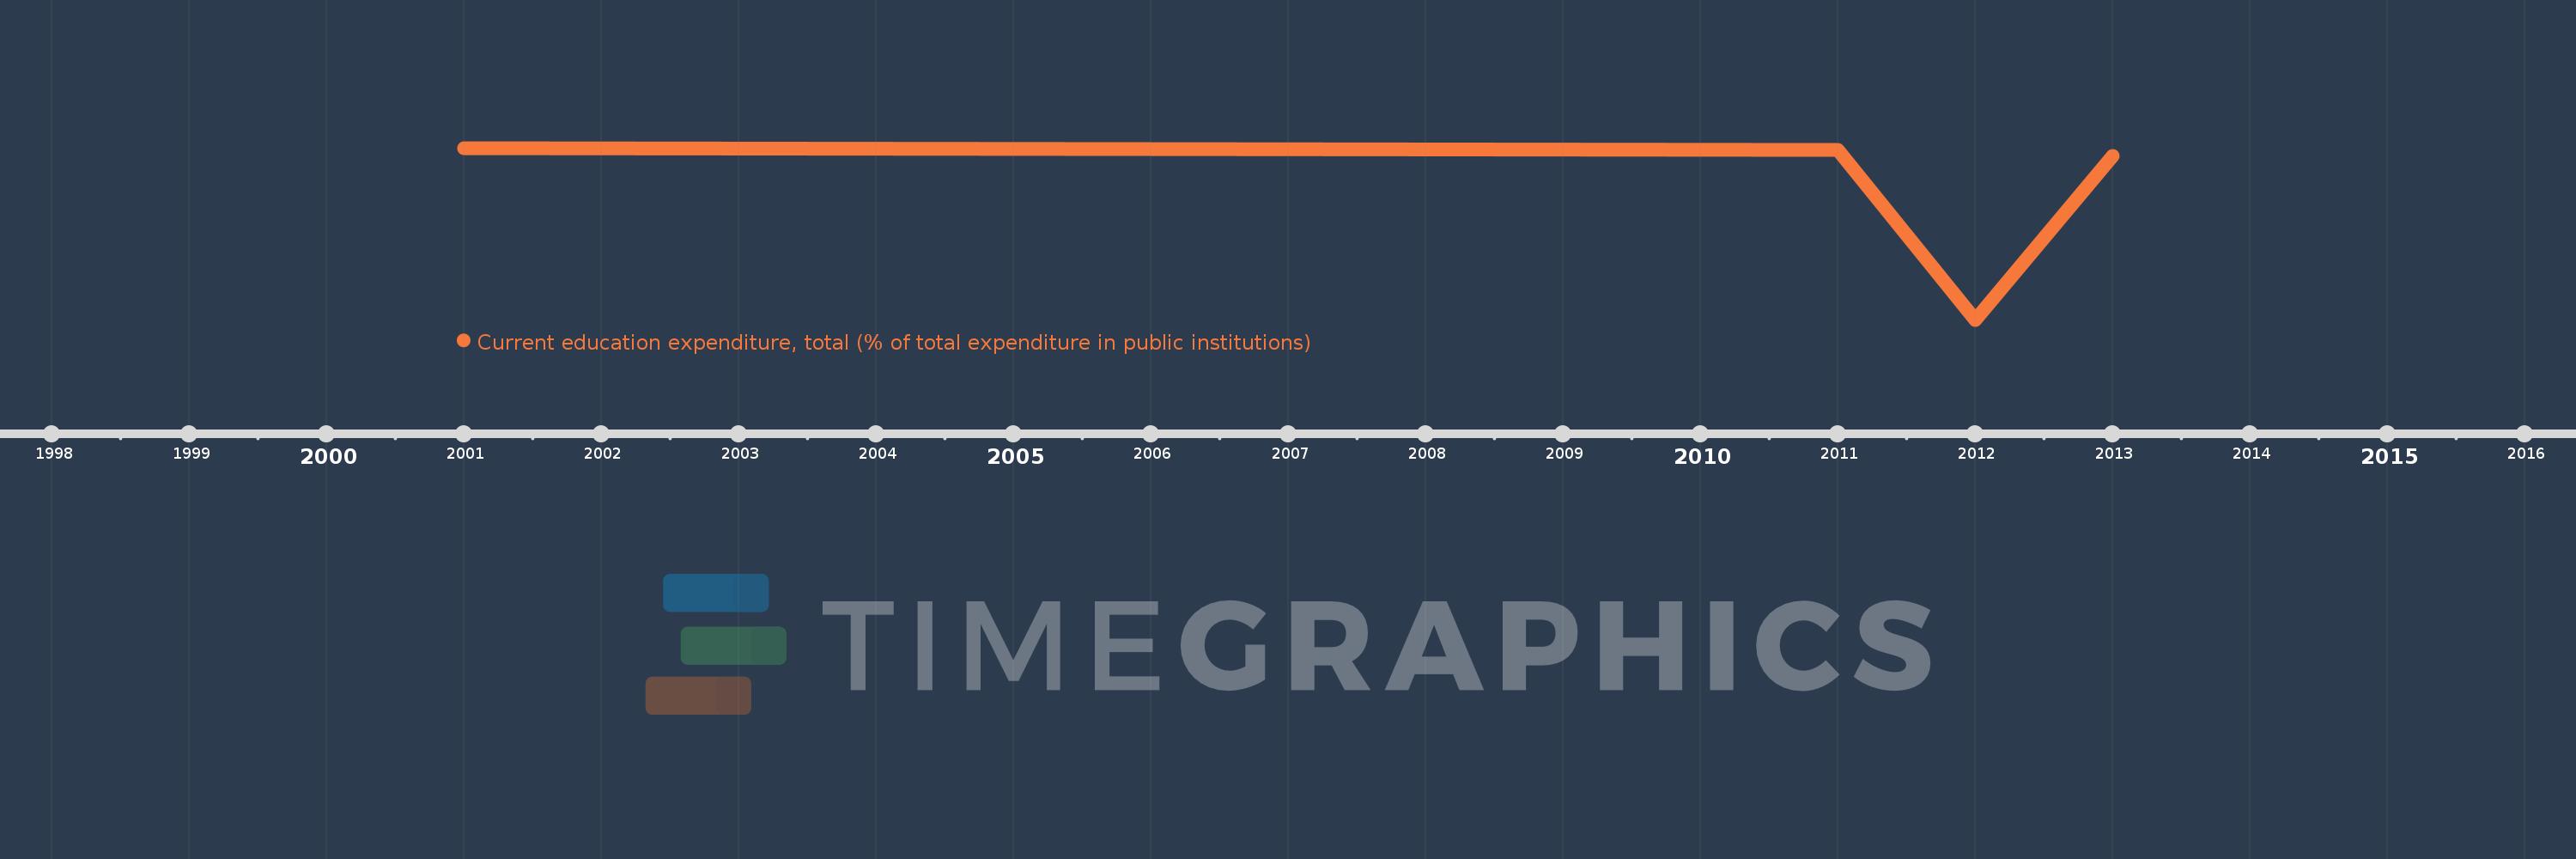
Current education expenditure, total (% of total expenditure in public institutions)
2013,2012,2011,2001
This statistics in other country:
Timeline:
This timeline shows a graph from 2001 to 2013 of Ecuador. No data until 2000. Number of actual observations by date: 4.
Source name:
World Development Indicators
Source organization:
United Nations Educational, Scientific, and Cultural Organization (UNESCO) Institute for Statistics.
Categories, topics:
Education
Last updated:
apr 23, 2017
Indicators value changes by year
Minimum:
47.529
jan 1, 2012
Maximum:
94.779
jan 1, 2001
At the date of observation
Value
Absolute change
Change from previous value
jan 1, 2001
94.779
+94.779
0.0%
jan 1, 2011
94.283
-0.496
-0.52%
jan 1, 2012
47.529
-46.753
-49.59%
jan 1, 2013
92.57
+45.041
94.76%
Ranking of countries by current statistics by years


Comments: