29
/
en
AIzaSyAYiBZKx7MnpbEhh9jyipgxe19OcubqV5w
April 1, 2024
74812
Azerbaijan
AZE
true
2
1
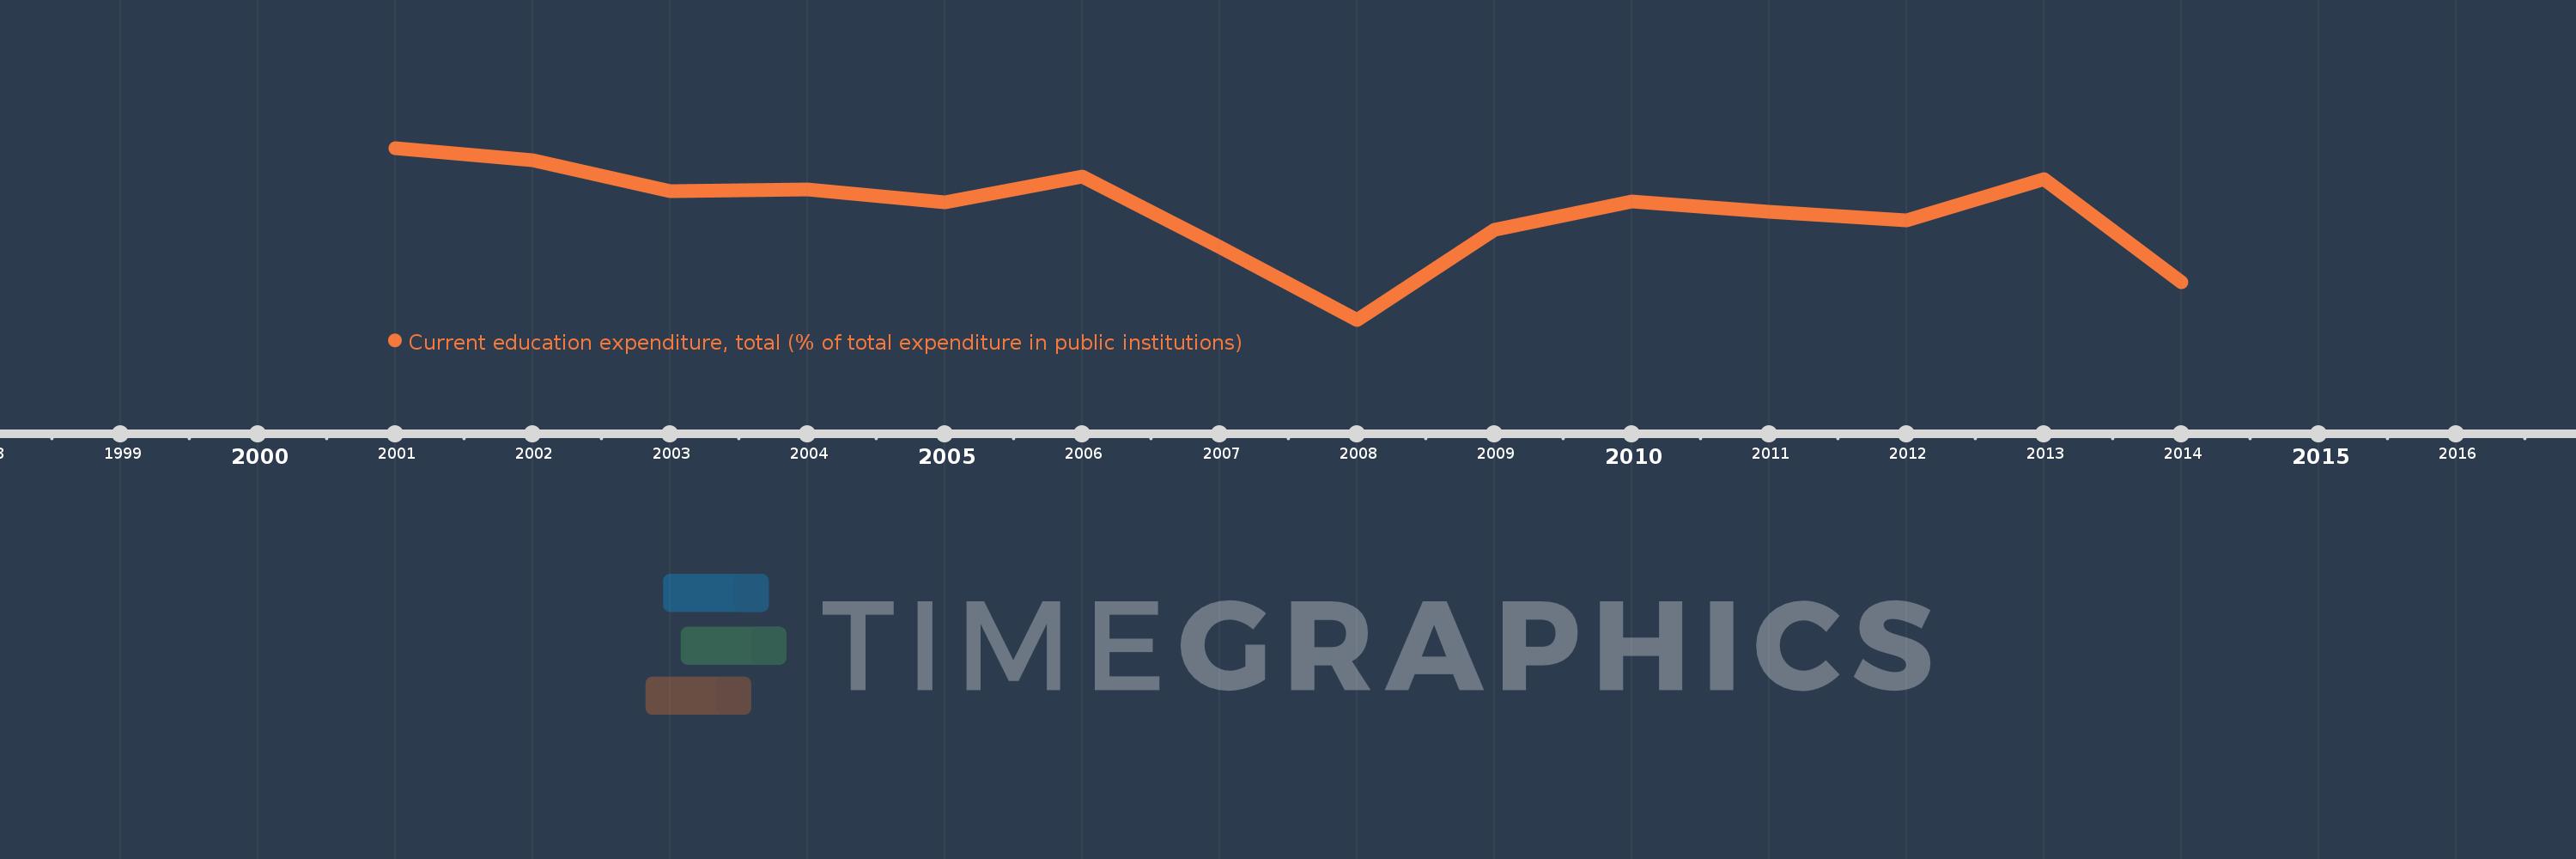
Current education expenditure, total (% of total expenditure in public institutions)
2014,2013,2012,2011,2010,2009,2008,2007,2006,2005,2004,2003,2002,2001
This statistics in other country:
Timeline:
This timeline shows a graph from 2001 to 2014 of Azerbaijan. No data until 2000. Number of actual observations by date: 14.
Source name:
World Development Indicators
Source organization:
United Nations Educational, Scientific, and Cultural Organization (UNESCO) Institute for Statistics.
Categories, topics:
Education
Last updated:
apr 23, 2017
Indicators value changes by year
At the date of observation
Value
Absolute change
Change from previous value
jan 1, 2001
99.1
+99.1
0.0%
jan 1, 2002
98.778
-0.322
-0.33%
jan 1, 2003
97.982
-0.796
-0.81%
jan 1, 2004
98.033
+0.051
0.05%
jan 1, 2005
97.695
-0.338
-0.34%
jan 1, 2006
98.36
+0.664
0.68%
jan 1, 2007
96.559
-1.801
-1.83%
jan 1, 2008
94.68
-1.879
-1.95%
jan 1, 2009
96.987
+2.306
2.44%
jan 1, 2010
97.717
+0.731
0.75%
jan 1, 2011
97.463
-0.254
-0.26%
jan 1, 2012
97.248
-0.215
-0.22%
jan 1, 2013
98.299
+1.052
1.08%
jan 1, 2014
95.642
-2.658
-2.7%
Ranking of countries by current statistics by years


Comments: