29
/
en
AIzaSyAYiBZKx7MnpbEhh9jyipgxe19OcubqV5w
April 1, 2024
220641
Paraguay
PRY
true
2
1
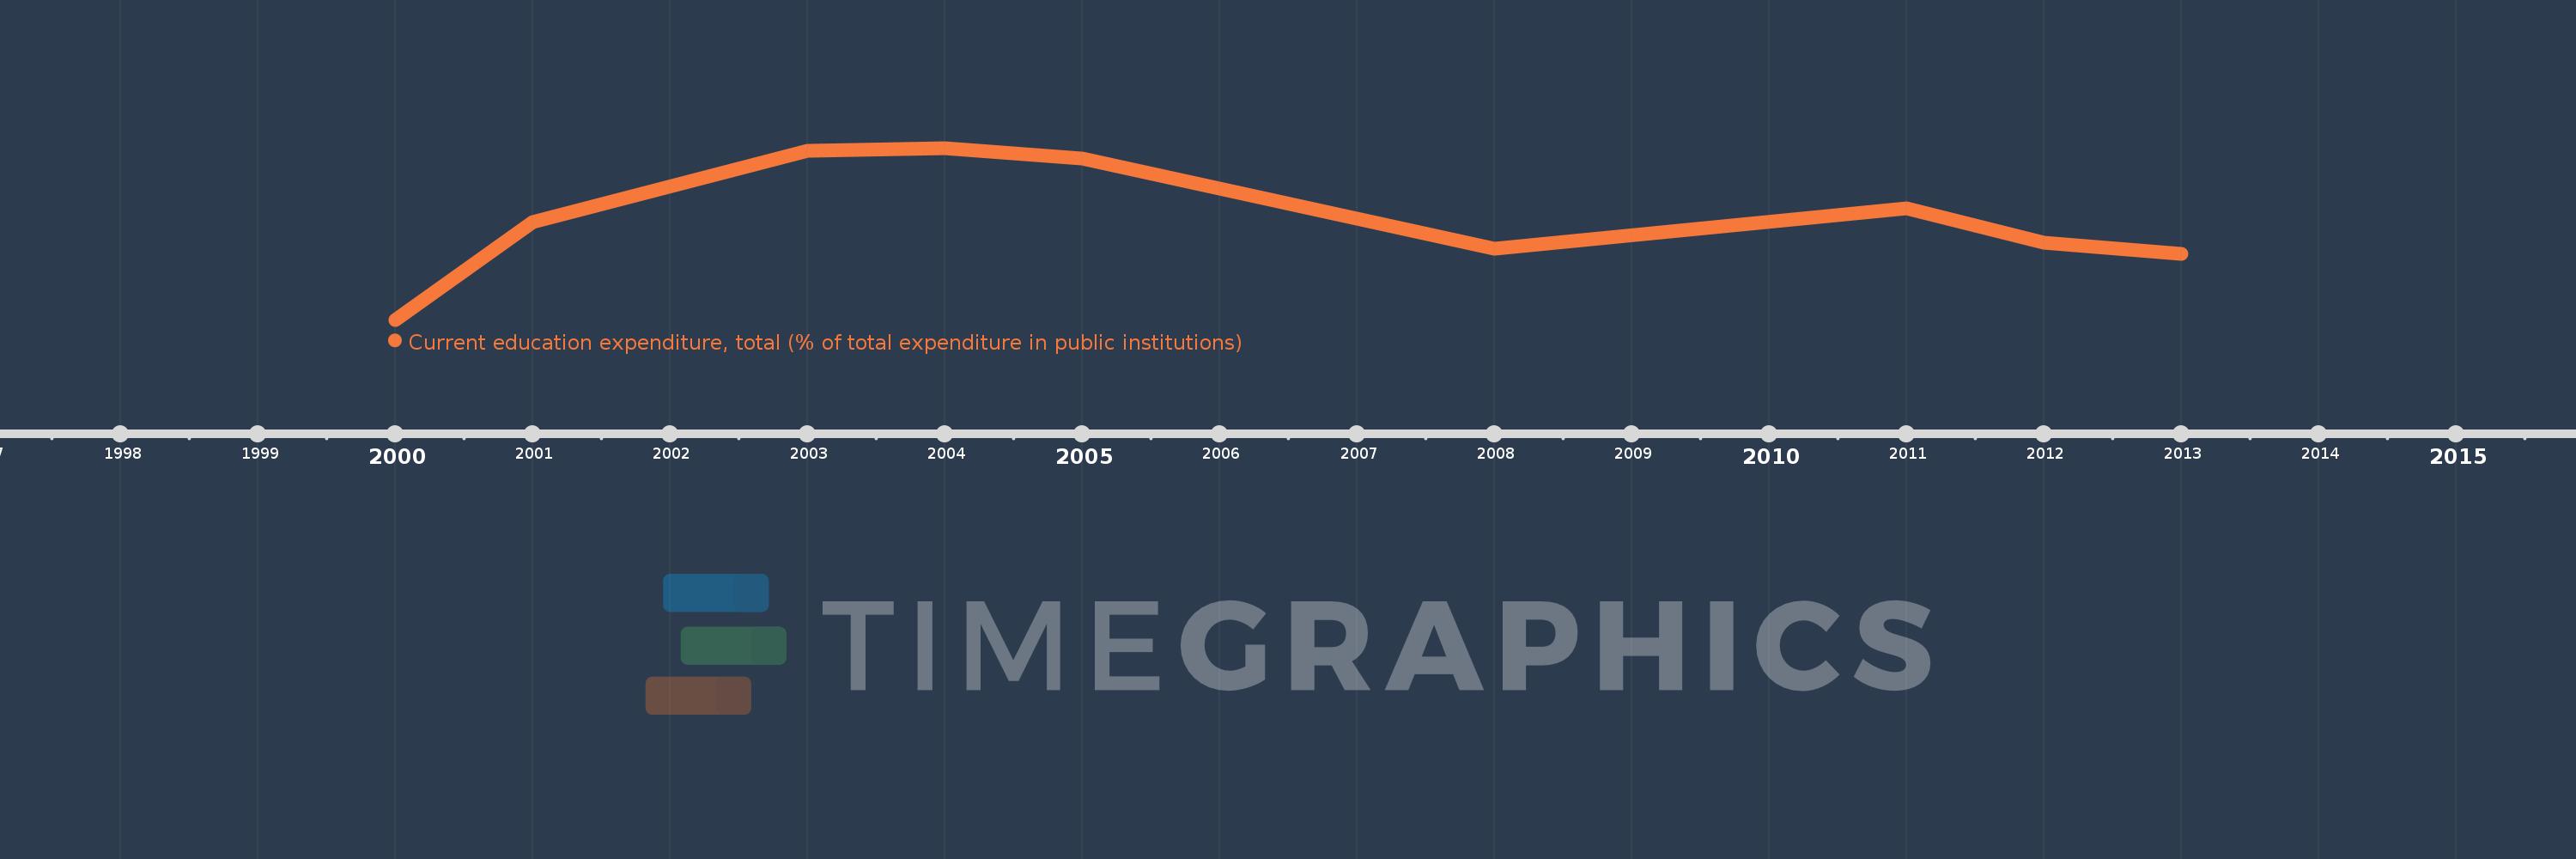
Current education expenditure, total (% of total expenditure in public institutions)
2013,2012,2011,2008,2005,2004,2003,2001,2000
This statistics in other country:
Timeline:
This timeline shows a graph from 2000 to 2013 of Paraguay. No data until 1999. Number of actual observations by date: 9.
Source name:
World Development Indicators
Source organization:
United Nations Educational, Scientific, and Cultural Organization (UNESCO) Institute for Statistics.
Categories, topics:
Education
Last updated:
apr 23, 2017
Indicators value changes by year
Minimum:
88.861
jan 1, 2000
At the date of observation
Value
Absolute change
Change from previous value
jan 1, 2000
88.861
+88.861
0.0%
jan 1, 2001
92.905
+4.044
4.55%
jan 1, 2003
95.877
+2.972
3.2%
jan 1, 2004
96.0
+0.123
0.13%
jan 1, 2005
95.565
-0.435
-0.45%
jan 1, 2008
91.801
-3.764
-3.94%
jan 1, 2011
93.483
+1.682
1.83%
jan 1, 2012
92.07
-1.413
-1.51%
jan 1, 2013
91.613
-0.457
-0.5%
Ranking of countries by current statistics by years


Comments: