29
/
en
AIzaSyAYiBZKx7MnpbEhh9jyipgxe19OcubqV5w
April 1, 2024
132996
Finland
FIN
true
2
1
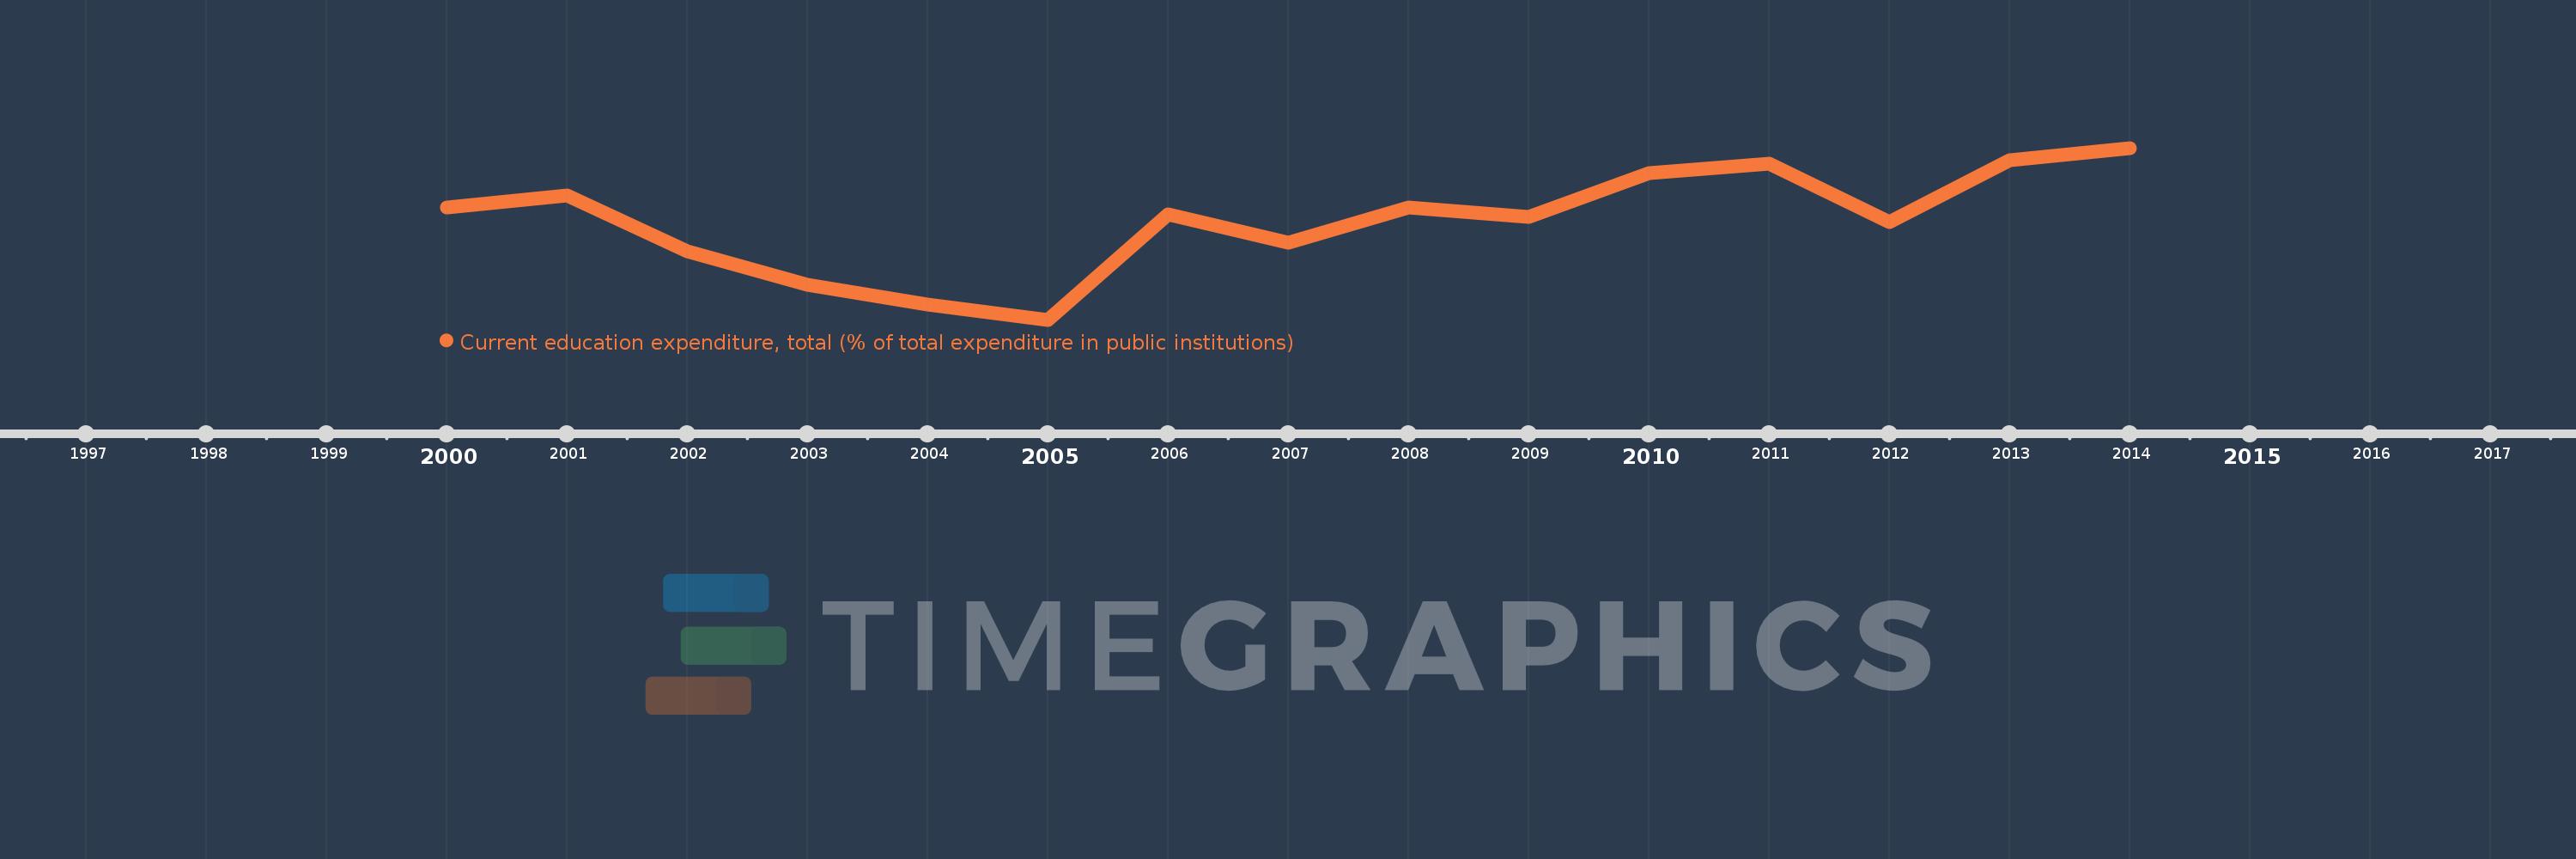
Current education expenditure, total (% of total expenditure in public institutions)
2014,2013,2012,2011,2010,2009,2008,2007,2006,2005,2004,2003,2002,2001,2000
This statistics in other country:
Timeline:
This timeline shows a graph from 2000 to 2014 of Finland. No data until 1999. Number of actual observations by date: 15.
Source name:
World Development Indicators
Source organization:
United Nations Educational, Scientific, and Cultural Organization (UNESCO) Institute for Statistics.
Categories, topics:
Education
Last updated:
apr 23, 2017
Indicators value changes by year
Minimum:
91.004
jan 1, 2005
Maximum:
94.217
jan 1, 2014
At the date of observation
Value
Absolute change
Change from previous value
jan 1, 2000
93.11
+93.11
0.0%
jan 1, 2001
93.327
+0.217
0.23%
jan 1, 2002
92.283
-1.044
-1.12%
jan 1, 2003
91.655
-0.628
-0.68%
jan 1, 2004
91.286
-0.368
-0.4%
jan 1, 2005
91.004
-0.282
-0.31%
jan 1, 2006
92.975
+1.971
2.17%
jan 1, 2007
92.453
-0.522
-0.56%
jan 1, 2008
93.102
+0.648
0.7%
jan 1, 2009
92.928
-0.174
-0.19%
jan 1, 2010
93.743
+0.815
0.88%
jan 1, 2011
93.925
+0.182
0.19%
jan 1, 2012
92.836
-1.089
-1.16%
jan 1, 2013
93.992
+1.156
1.25%
jan 1, 2014
94.217
+0.225
0.24%
Ranking of countries by current statistics by years


Comments: