29
/
en
AIzaSyAYiBZKx7MnpbEhh9jyipgxe19OcubqV5w
April 1, 2024
93388
Bulgaria
BGR
true
2
1
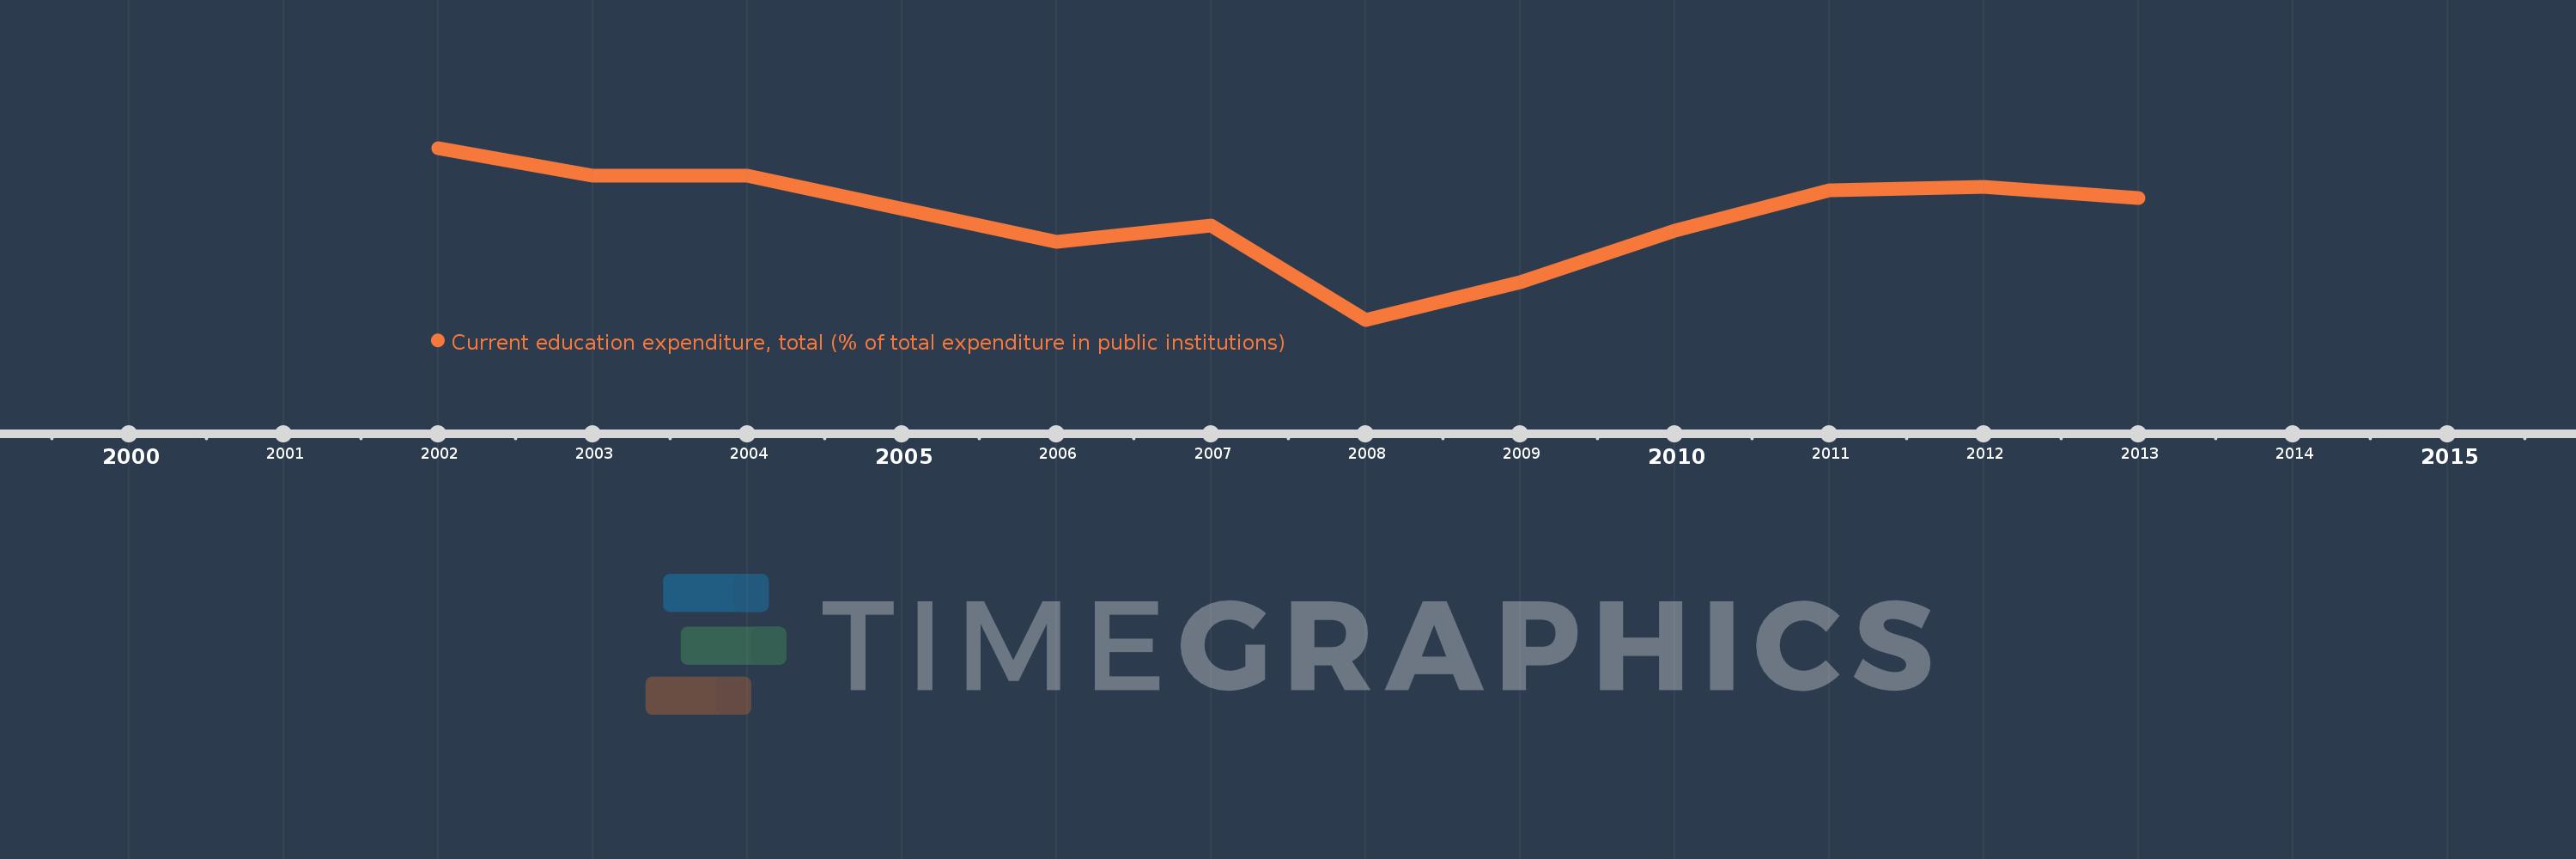
Current education expenditure, total (% of total expenditure in public institutions)
2013,2012,2011,2010,2009,2008,2007,2006,2004,2003,2002
This statistics in other country:
Timeline:
This timeline shows a graph from 2002 to 2013 of Bulgaria. No data until 2001. Number of actual observations by date: 11.
Source name:
World Development Indicators
Source organization:
United Nations Educational, Scientific, and Cultural Organization (UNESCO) Institute for Statistics.
Categories, topics:
Education
Last updated:
apr 23, 2017
Indicators value changes by year
Minimum:
82.408
jan 1, 2008
Maximum:
98.979
jan 1, 2002
At the date of observation
Value
Absolute change
Change from previous value
jan 1, 2002
98.979
+98.979
0.0%
jan 1, 2003
96.286
-2.693
-2.72%
jan 1, 2004
96.323
+0.037
0.04%
jan 1, 2006
89.89
-6.434
-6.68%
jan 1, 2007
91.5
+1.61
1.79%
jan 1, 2008
82.408
-9.092
-9.94%
jan 1, 2009
86.028
+3.62
4.39%
jan 1, 2010
90.998
+4.97
5.78%
jan 1, 2011
94.931
+3.933
4.32%
jan 1, 2012
95.229
+0.297
0.31%
jan 1, 2013
94.138
-1.09
-1.14%
Ranking of countries by current statistics by years


Comments: