29
/
en
AIzaSyAYiBZKx7MnpbEhh9jyipgxe19OcubqV5w
April 1, 2024
155796
Indonesia
IDN
true
2
1
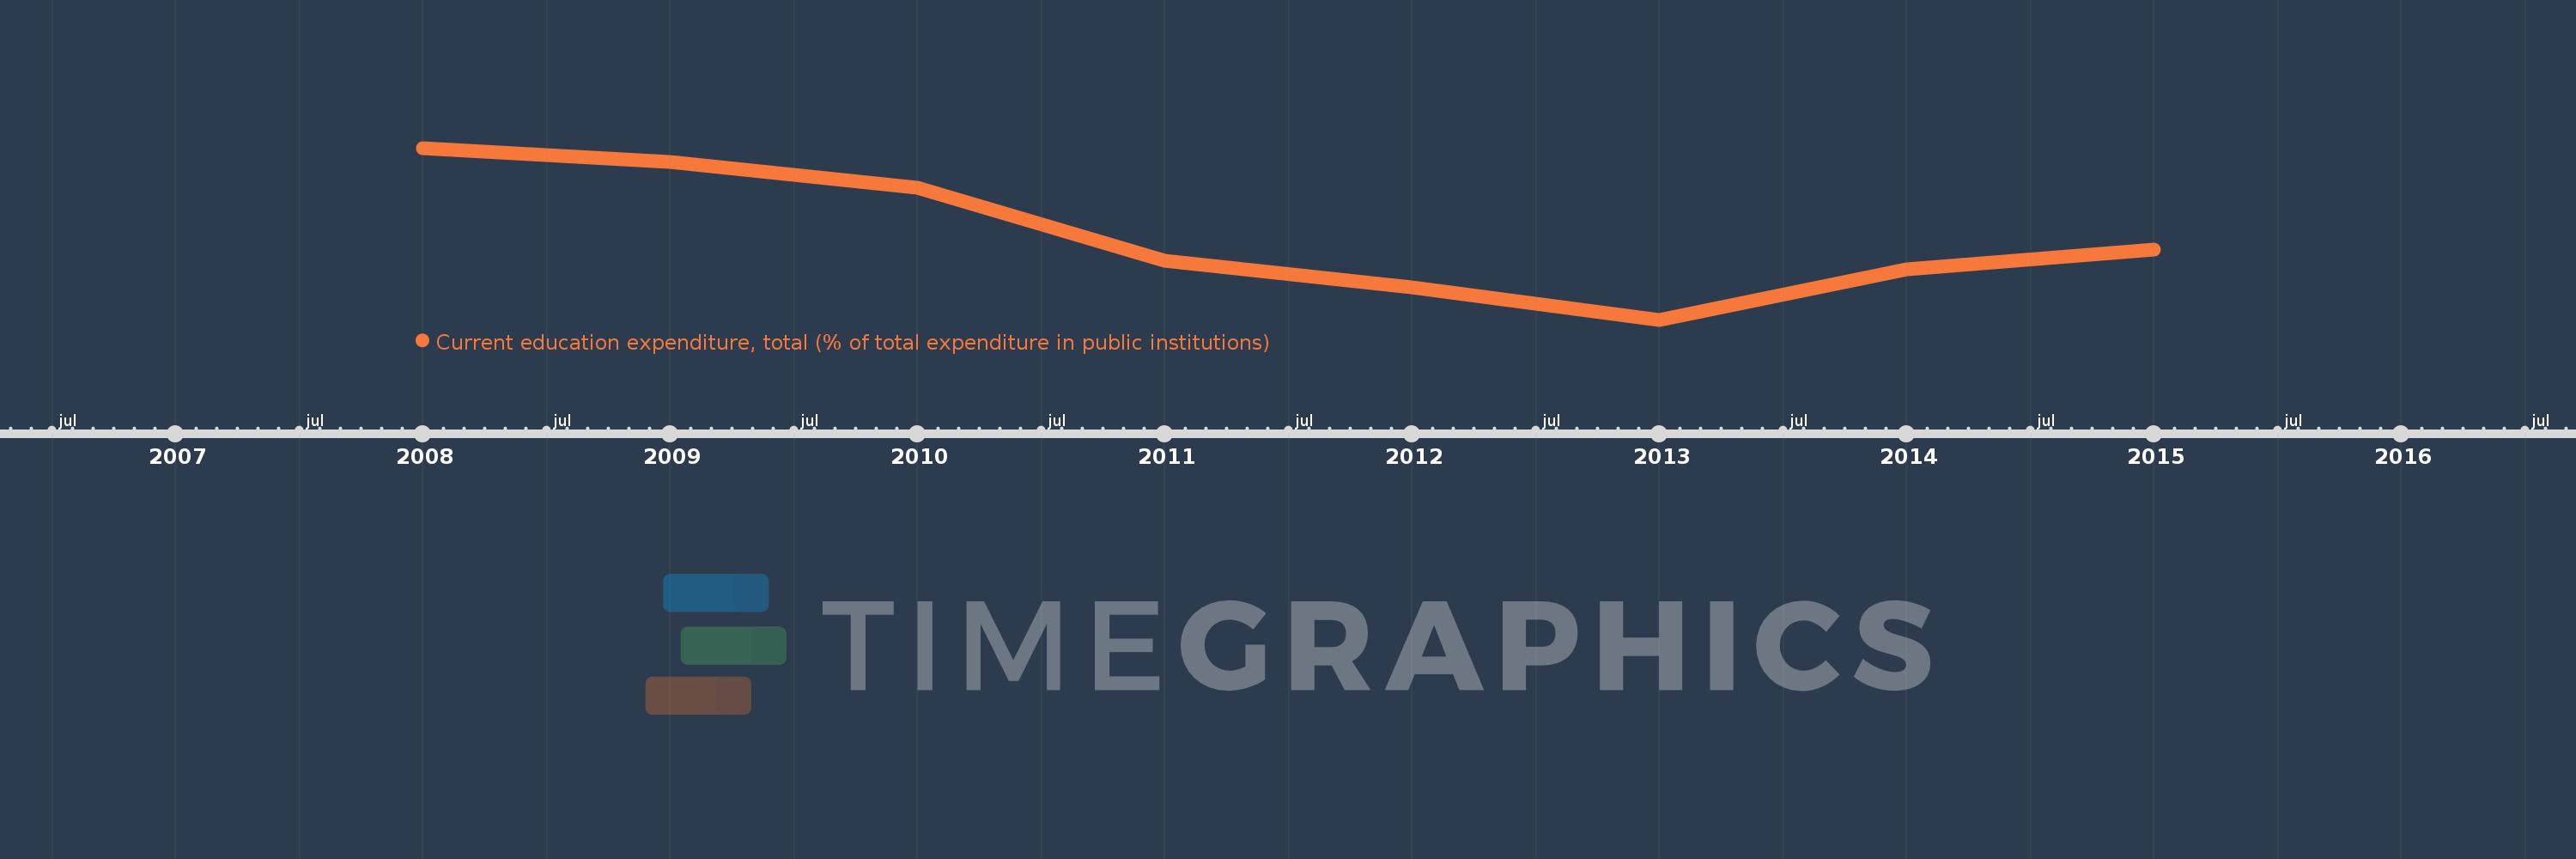
Current education expenditure, total (% of total expenditure in public institutions)
2015,2014,2013,2012,2011,2010,2009,2008
This statistics in other country:
Timeline:
This timeline shows a graph from 2008 to 2015 of Indonesia. No data until 2007. Number of actual observations by date: 8.
Source name:
World Development Indicators
Source organization:
United Nations Educational, Scientific, and Cultural Organization (UNESCO) Institute for Statistics.
Categories, topics:
Education
Last updated:
apr 23, 2017
Indicators value changes by year
Minimum:
86.643
jan 1, 2013
At the date of observation
Value
Absolute change
Change from previous value
jan 1, 2008
90.76
+90.76
0.0%
jan 1, 2009
90.415
-0.345
-0.38%
jan 1, 2010
89.811
-0.604
-0.67%
jan 1, 2011
88.052
-1.759
-1.96%
jan 1, 2012
87.426
-0.627
-0.71%
jan 1, 2013
86.643
-0.782
-0.89%
jan 1, 2014
87.857
+1.213
1.4%
jan 1, 2015
88.322
+0.465
0.53%
Ranking of countries by current statistics by years


Comments: