29
/
en
AIzaSyAYiBZKx7MnpbEhh9jyipgxe19OcubqV5w
April 1, 2024
267807
Tunisia
TUN
true
2
1
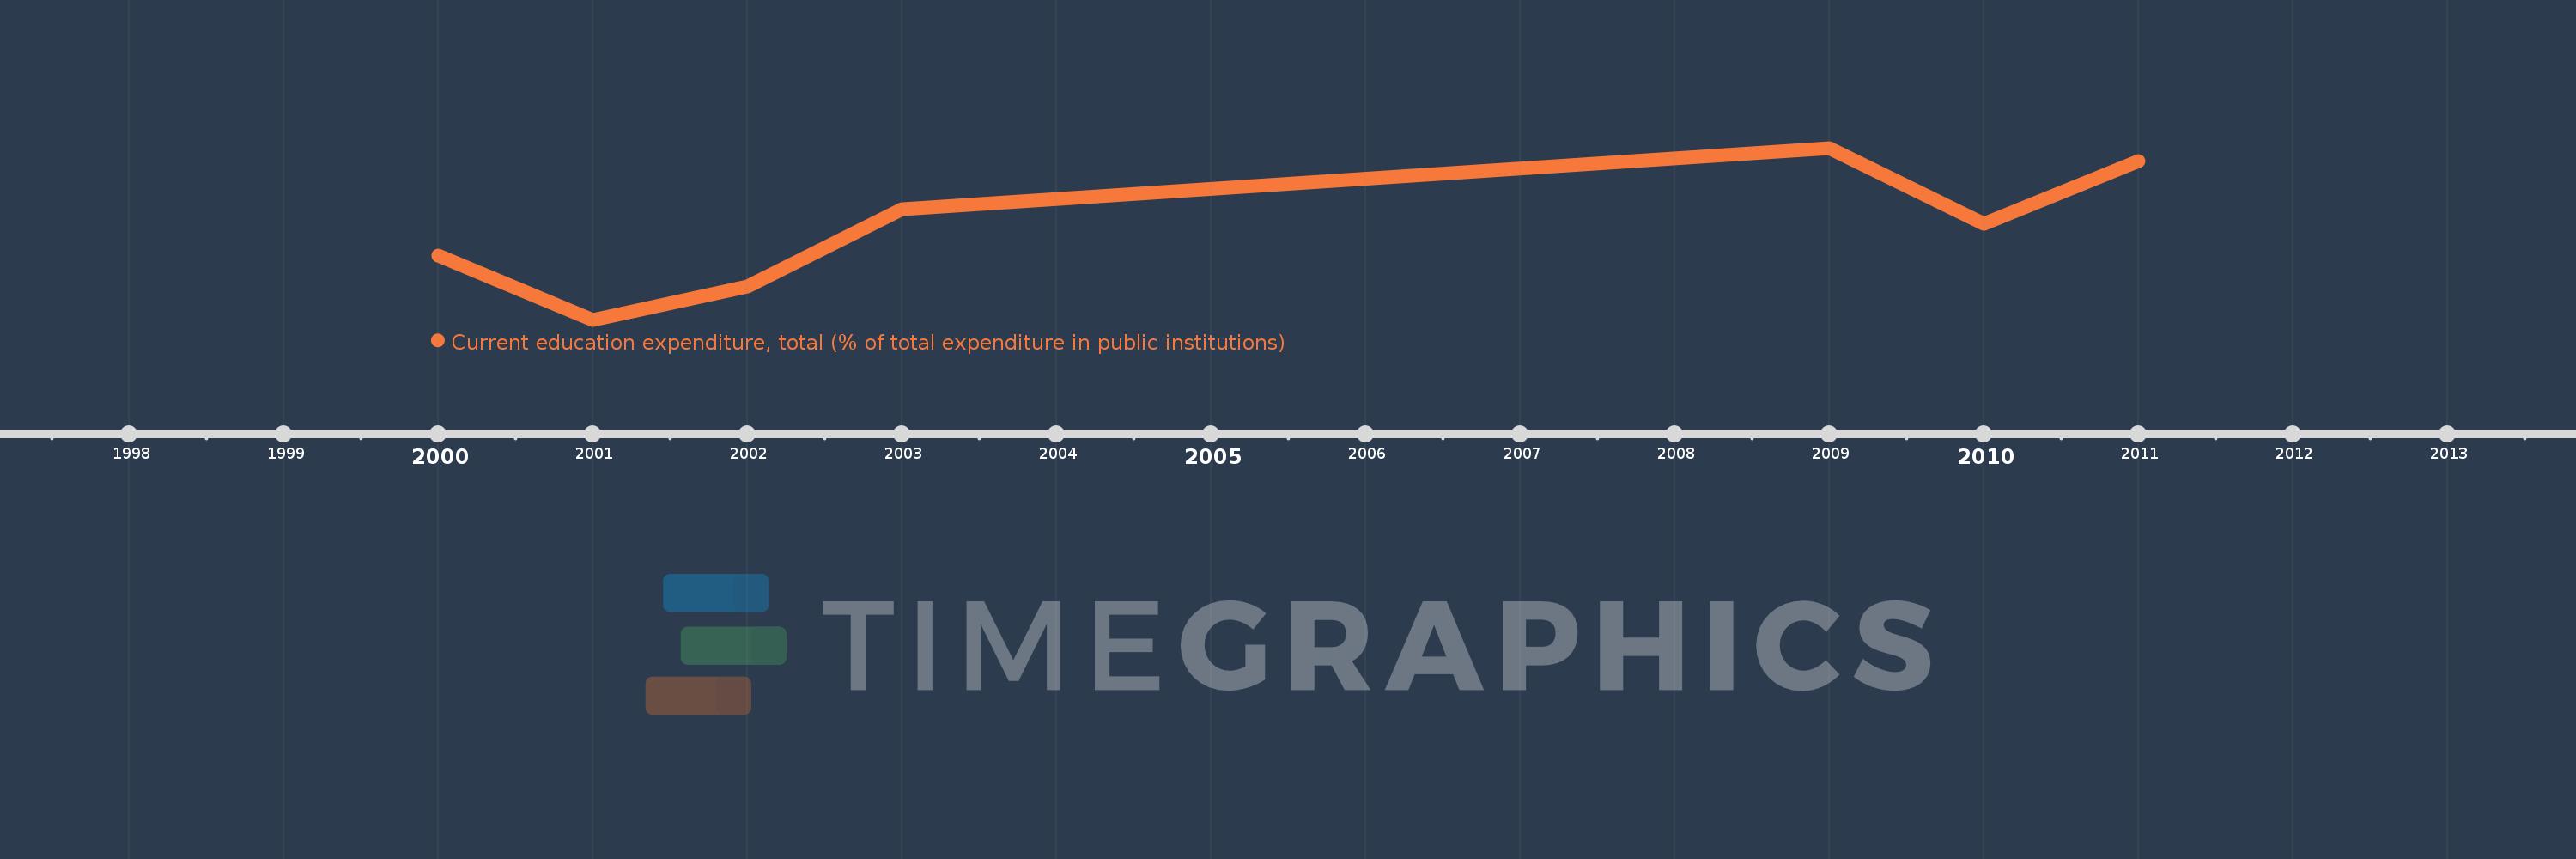
Current education expenditure, total (% of total expenditure in public institutions)
2011,2010,2009,2003,2002,2001,2000
This statistics in other country:
Timeline:
This timeline shows a graph from 2000 to 2011 of Tunisia. No data until 1999. Number of actual observations by date: 7.
Source name:
World Development Indicators
Source organization:
United Nations Educational, Scientific, and Cultural Organization (UNESCO) Institute for Statistics.
Categories, topics:
Education
Last updated:
apr 23, 2017
Indicators value changes by year
Minimum:
85.515
jan 1, 2001
At the date of observation
Value
Absolute change
Change from previous value
jan 1, 2000
87.184
+87.184
0.0%
jan 1, 2001
85.515
-1.669
-1.91%
jan 1, 2002
86.392
+0.877
1.03%
jan 1, 2003
88.399
+2.007
2.32%
jan 1, 2009
89.99
+1.591
1.8%
jan 1, 2010
88.025
-1.965
-2.18%
jan 1, 2011
89.649
+1.624
1.85%
Ranking of countries by current statistics by years


Comments: