29
/
en
AIzaSyAYiBZKx7MnpbEhh9jyipgxe19OcubqV5w
April 1, 2024
99744
Cameroon
CMR
true
2
1
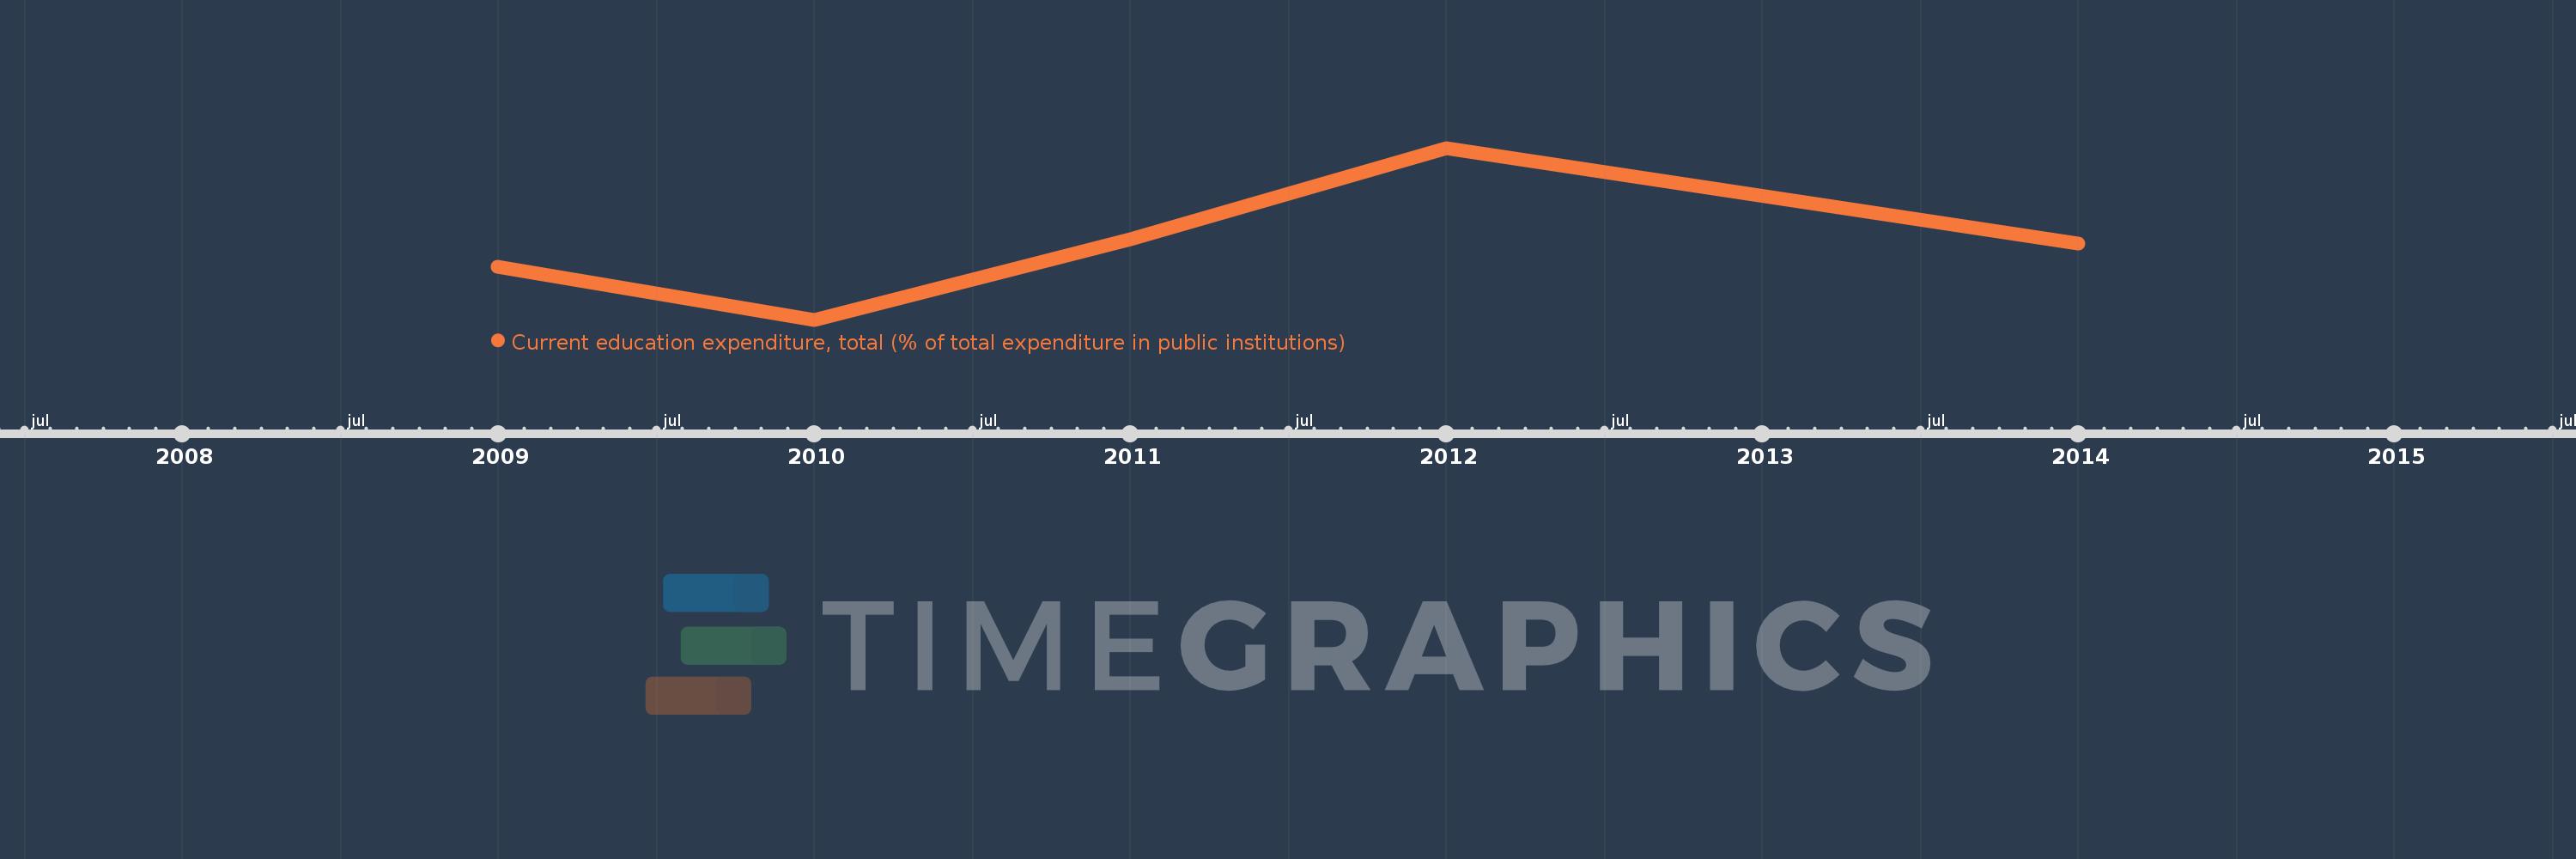
Current education expenditure, total (% of total expenditure in public institutions)
2014,2012,2011,2010,2009
This statistics in other country:
Timeline:
This timeline shows a graph from 2009 to 2014 of Cameroon. No data until 2008. Number of actual observations by date: 5.
Source name:
World Development Indicators
Source organization:
United Nations Educational, Scientific, and Cultural Organization (UNESCO) Institute for Statistics.
Categories, topics:
Education
Last updated:
apr 23, 2017
Indicators value changes by year
Minimum:
81.677
jan 1, 2010
Maximum:
92.245
jan 1, 2012
At the date of observation
Value
Absolute change
Change from previous value
jan 1, 2009
84.915
+84.915
0.0%
jan 1, 2010
81.677
-3.237
-3.81%
jan 1, 2011
86.643
+4.965
6.08%
jan 1, 2012
92.245
+5.602
6.47%
jan 1, 2014
86.389
-5.856
-6.35%
Ranking of countries by current statistics by years


Comments: