29
/
en
AIzaSyAYiBZKx7MnpbEhh9jyipgxe19OcubqV5w
April 1, 2024
241434
Slovak Republic
SVK
true
2
1
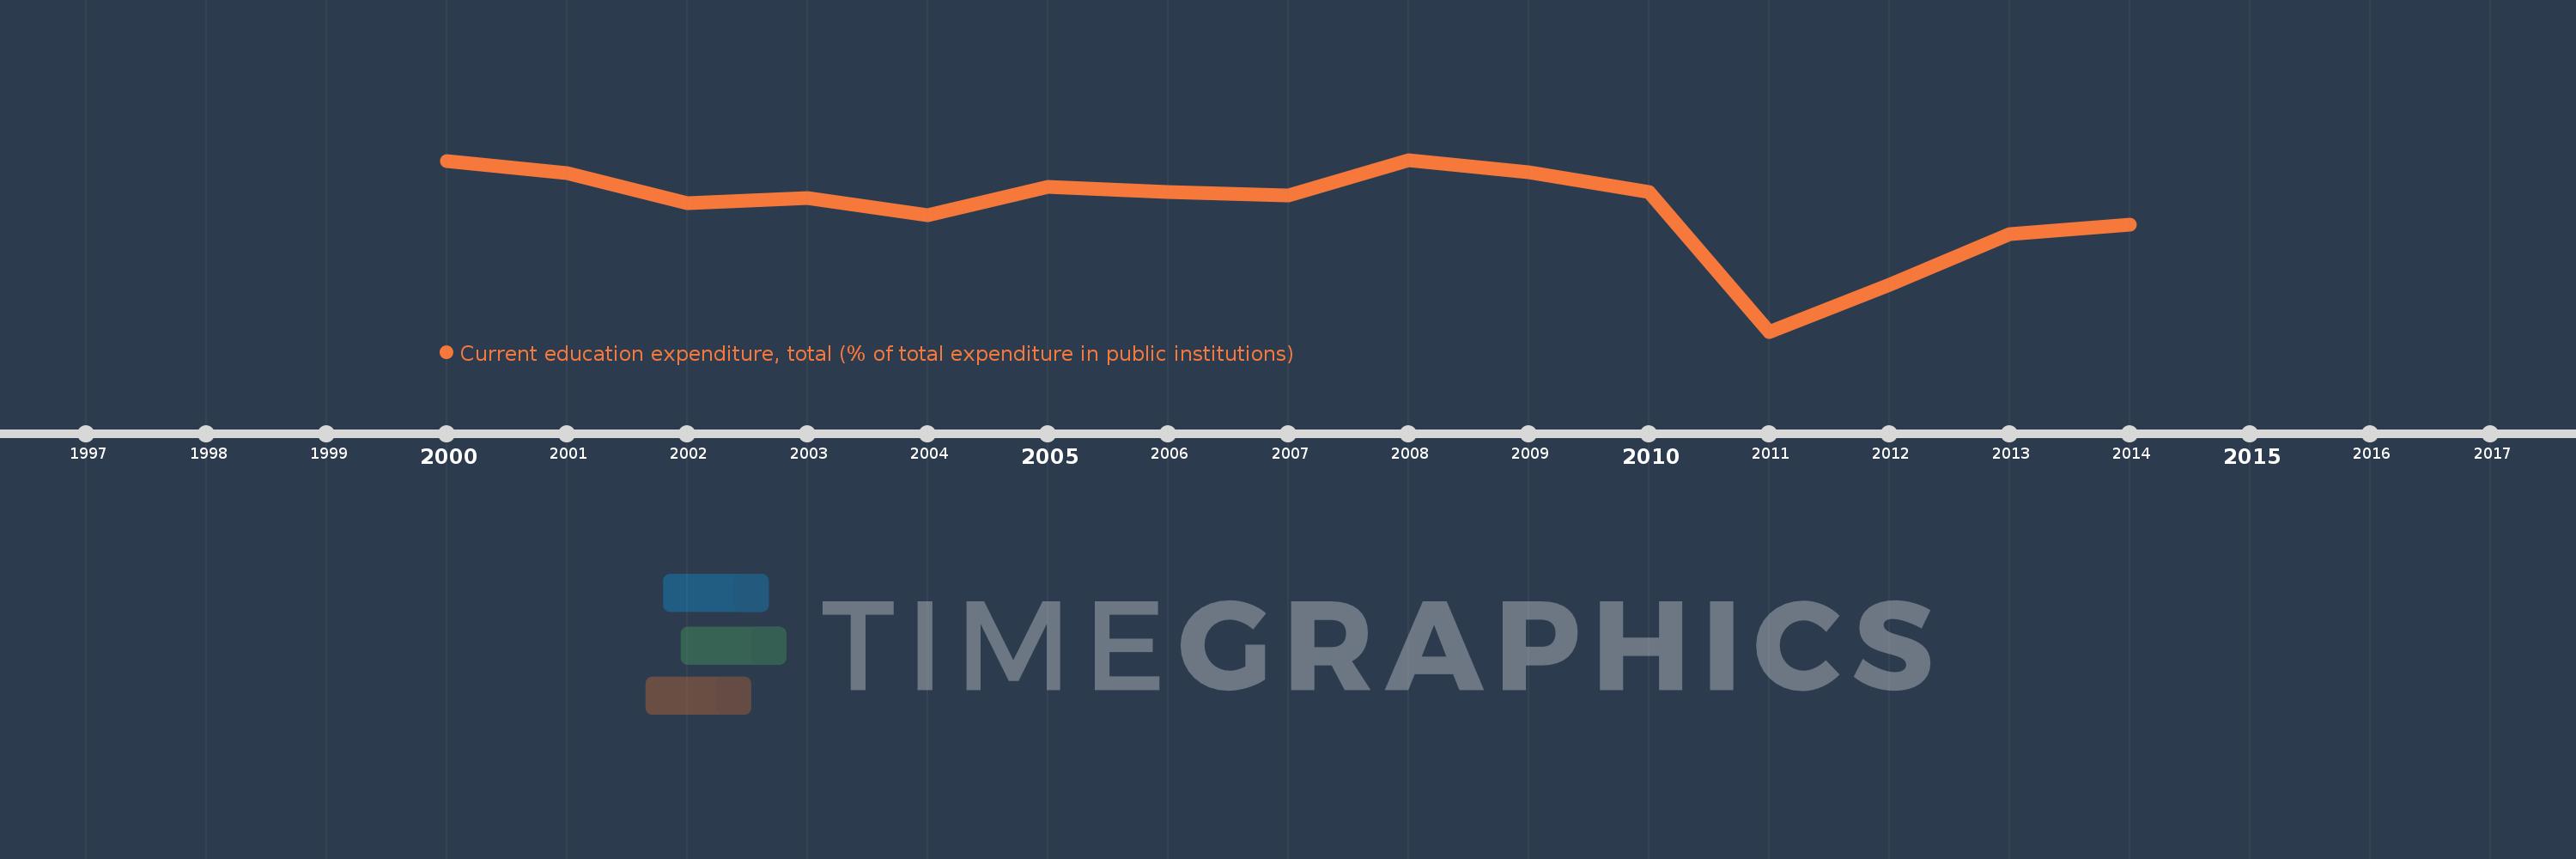
Current education expenditure, total (% of total expenditure in public institutions)
2014,2013,2012,2011,2010,2009,2008,2007,2006,2005,2004,2003,2002,2001,2000
This statistics in other country:
Timeline:
This timeline shows a graph from 2000 to 2014 of Slovak Republic. No data until 1999. Number of actual observations by date: 15.
Source name:
World Development Indicators
Source organization:
United Nations Educational, Scientific, and Cultural Organization (UNESCO) Institute for Statistics.
Categories, topics:
Education
Last updated:
apr 23, 2017
Indicators value changes by year
Minimum:
87.818
jan 1, 2011
At the date of observation
Value
Absolute change
Change from previous value
jan 1, 2000
95.801
+95.801
0.0%
jan 1, 2001
95.244
-0.558
-0.58%
jan 1, 2002
93.827
-1.417
-1.49%
jan 1, 2003
94.073
+0.247
0.26%
jan 1, 2004
93.27
-0.804
-0.85%
jan 1, 2005
94.589
+1.32
1.41%
jan 1, 2006
94.364
-0.225
-0.24%
jan 1, 2007
94.194
-0.17
-0.18%
jan 1, 2008
95.86
+1.666
1.77%
jan 1, 2009
95.281
-0.579
-0.6%
jan 1, 2010
94.347
-0.933
-0.98%
jan 1, 2011
87.818
-6.529
-6.92%
jan 1, 2012
90.013
+2.195
2.5%
jan 1, 2013
92.381
+2.368
2.63%
jan 1, 2014
92.825
+0.444
0.48%
Ranking of countries by current statistics by years


Comments: