29
/
en
AIzaSyAYiBZKx7MnpbEhh9jyipgxe19OcubqV5w
April 1, 2024
242433
Slovenia
SVN
true
2
1
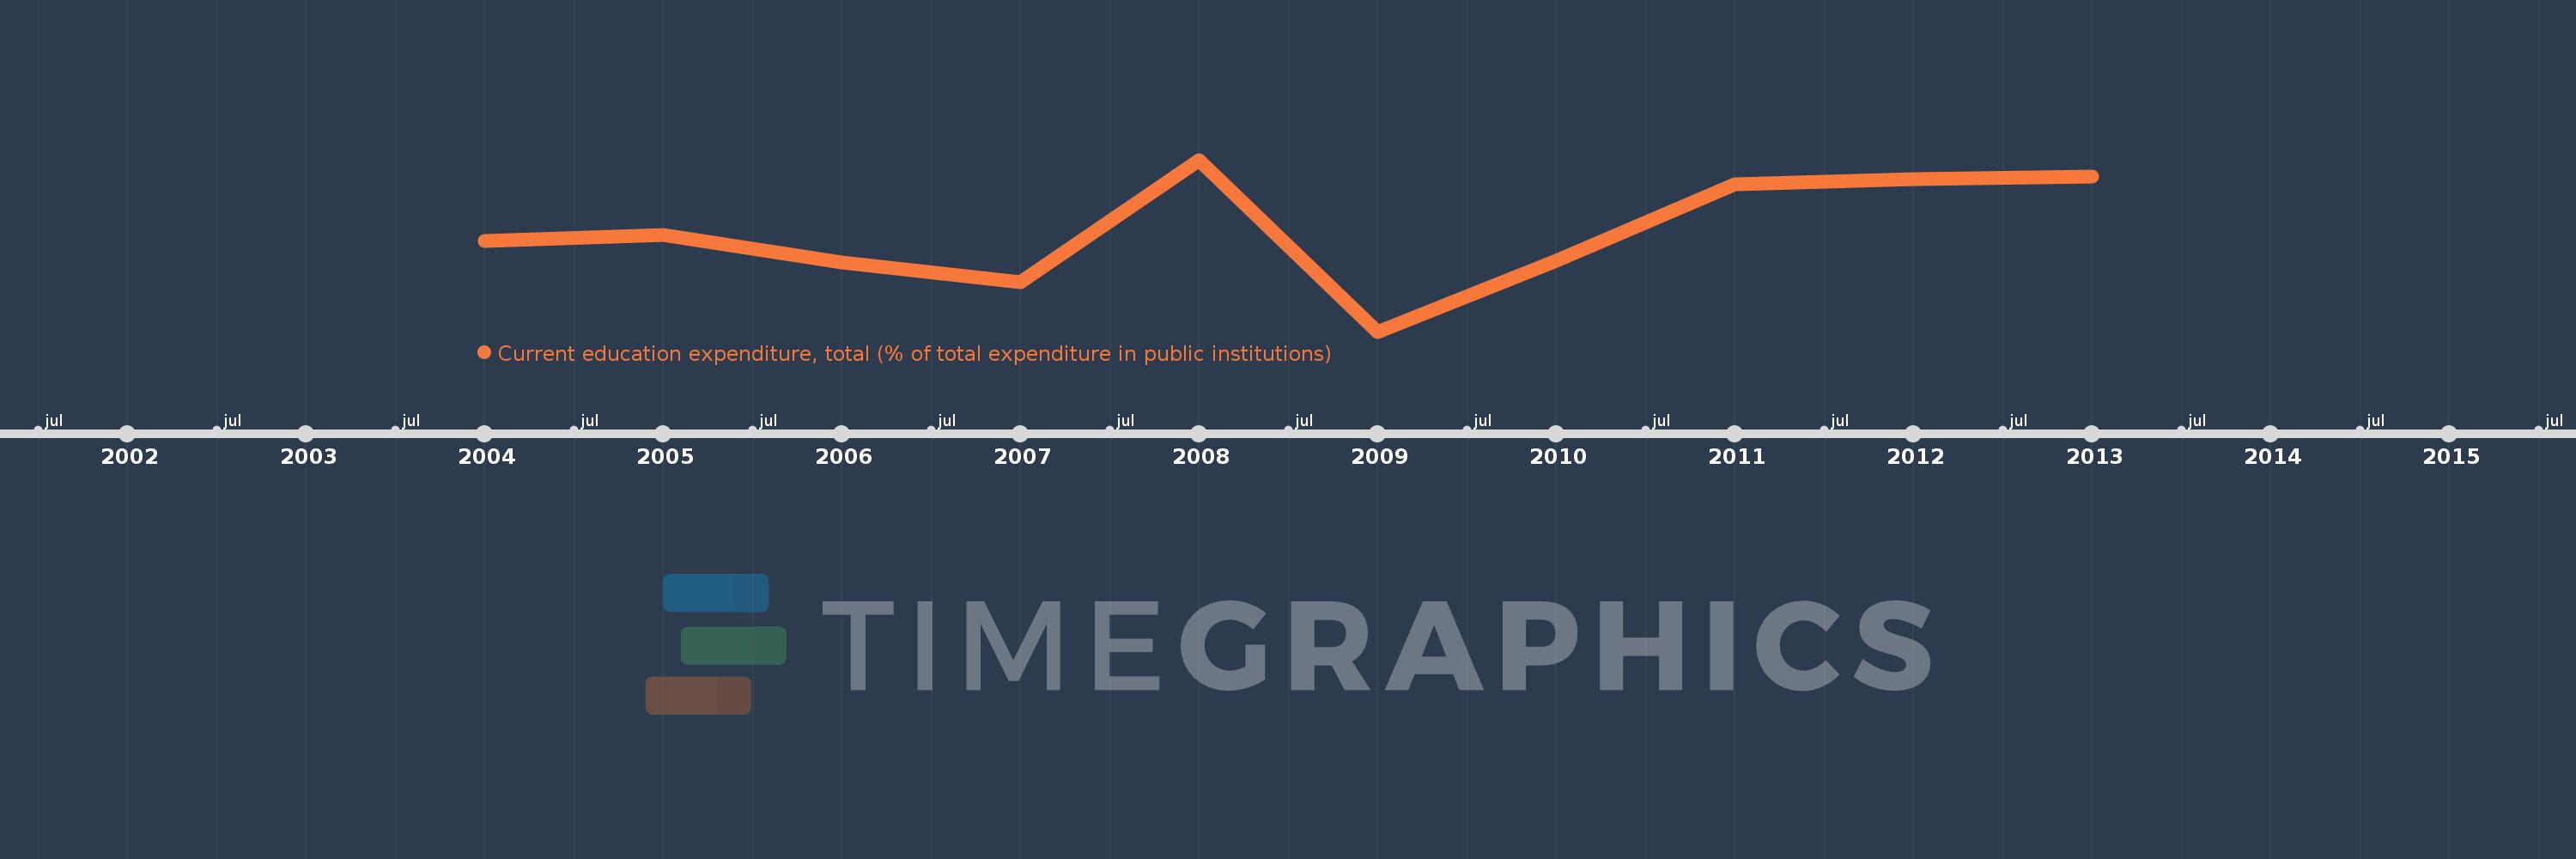
Current education expenditure, total (% of total expenditure in public institutions)
2013,2012,2011,2010,2009,2008,2007,2006,2005,2004
This statistics in other country:
Timeline:
This timeline shows a graph from 2004 to 2013 of Slovenia. No data until 2003. Number of actual observations by date: 10.
Source name:
World Development Indicators
Source organization:
United Nations Educational, Scientific, and Cultural Organization (UNESCO) Institute for Statistics.
Categories, topics:
Education
Last updated:
apr 23, 2017
Indicators value changes by year
Minimum:
88.872
jan 1, 2009
Maximum:
91.739
jan 1, 2008
At the date of observation
Value
Absolute change
Change from previous value
jan 1, 2004
90.379
+90.379
0.0%
jan 1, 2005
90.488
+0.11
0.12%
jan 1, 2006
90.028
-0.46
-0.51%
jan 1, 2007
89.697
-0.331
-0.37%
jan 1, 2008
91.739
+2.042
2.28%
jan 1, 2009
88.872
-2.867
-3.13%
jan 1, 2010
90.059
+1.187
1.34%
jan 1, 2011
91.336
+1.277
1.42%
jan 1, 2012
91.423
+0.087
0.1%
jan 1, 2013
91.456
+0.033
0.04%
Ranking of countries by current statistics by years


Comments: