29
/
en
AIzaSyAYiBZKx7MnpbEhh9jyipgxe19OcubqV5w
April 1, 2024
225741
Portugal
PRT
true
2
1
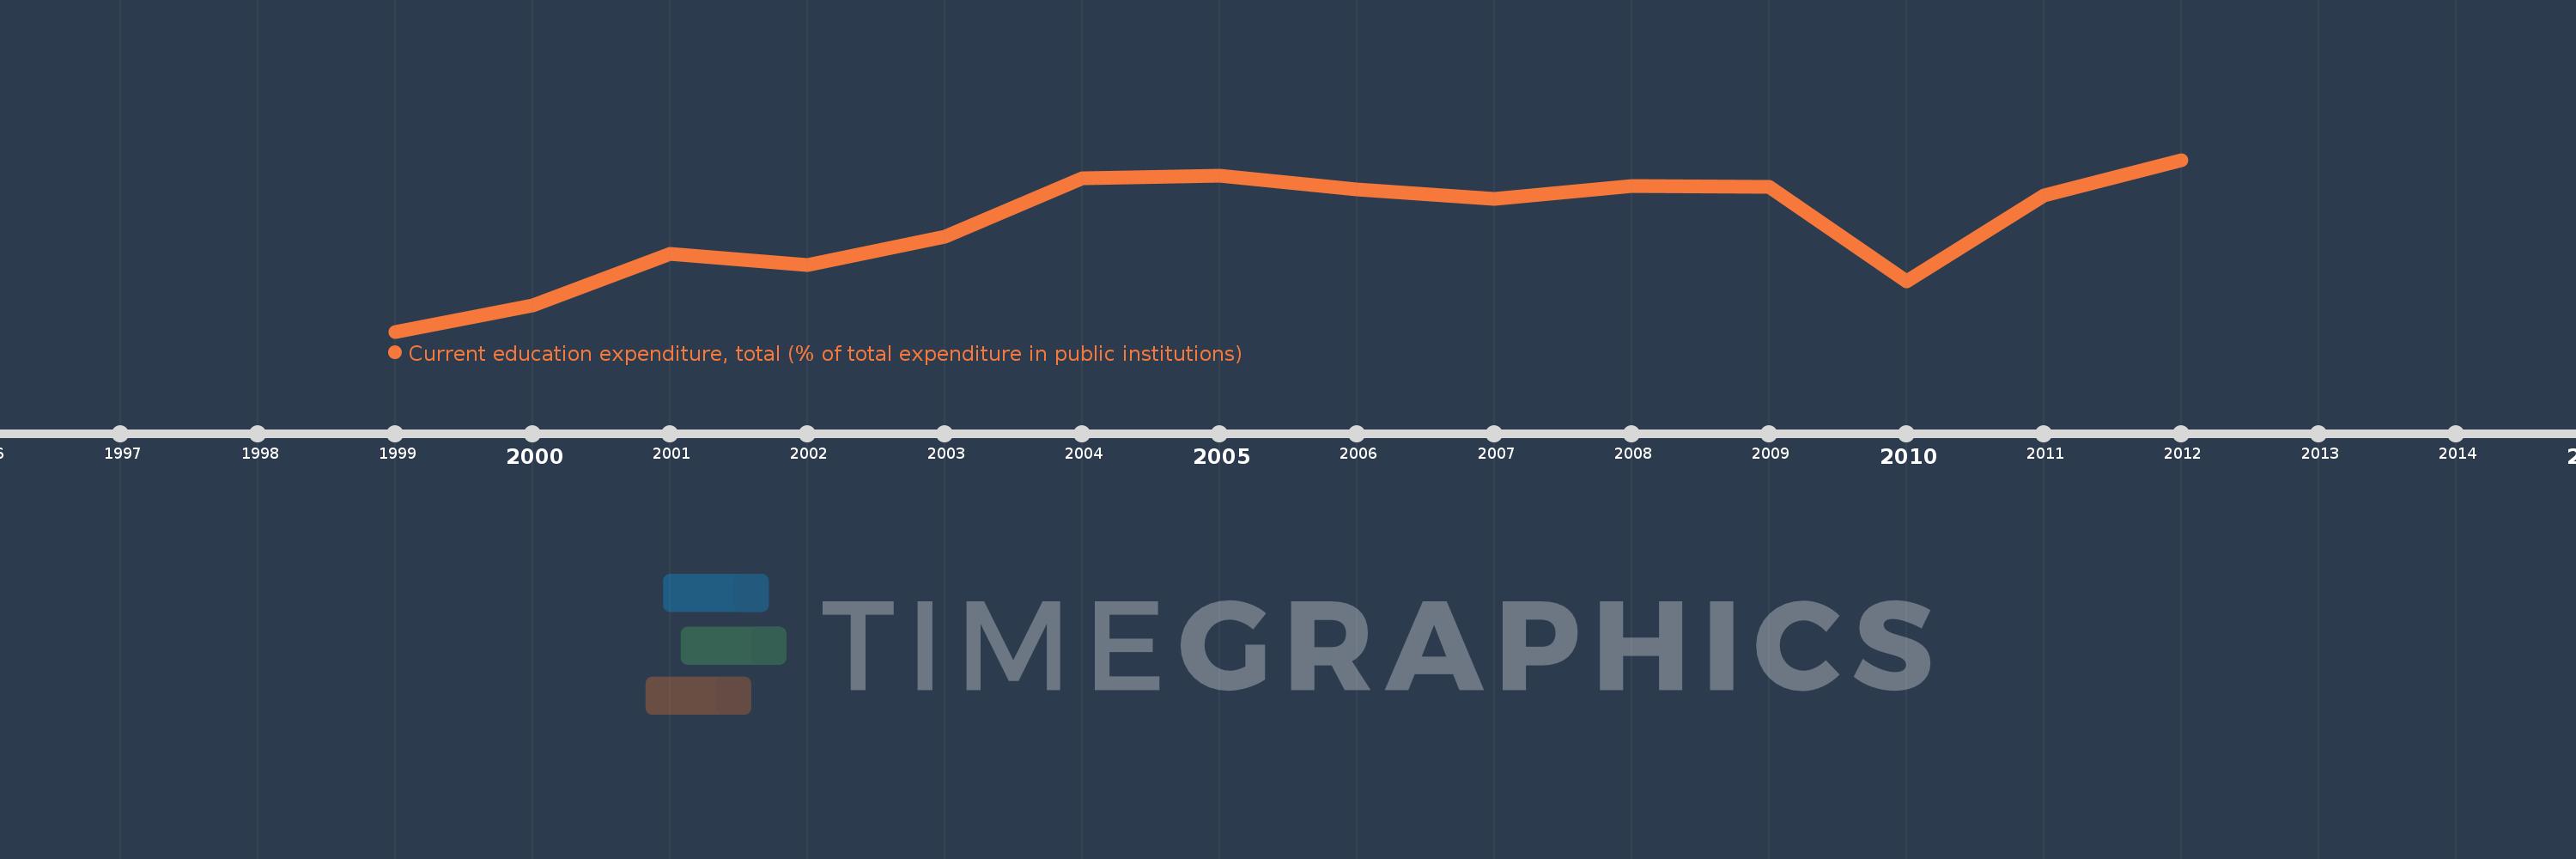
Current education expenditure, total (% of total expenditure in public institutions)
2012,2011,2010,2009,2008,2007,2006,2005,2004,2003,2002,2001,2000,1999
This statistics in other country:
Timeline:
This timeline shows a graph from 1999 to 2012 of Portugal. No data until 1998. Number of actual observations by date: 14.
Source name:
World Development Indicators
Source organization:
United Nations Educational, Scientific, and Cultural Organization (UNESCO) Institute for Statistics.
Categories, topics:
Education
Last updated:
apr 23, 2017
Indicators value changes by year
Minimum:
92.308
jan 1, 1999
Maximum:
97.242
jan 1, 2012
At the date of observation
Value
Absolute change
Change from previous value
jan 1, 1999
92.308
+92.308
0.0%
jan 1, 2000
93.071
+0.763
0.83%
jan 1, 2001
94.535
+1.464
1.57%
jan 1, 2002
94.222
-0.313
-0.33%
jan 1, 2003
95.027
+0.805
0.85%
jan 1, 2004
96.711
+1.684
1.77%
jan 1, 2005
96.793
+0.082
0.09%
jan 1, 2006
96.4
-0.393
-0.41%
jan 1, 2007
96.108
-0.292
-0.3%
jan 1, 2008
96.478
+0.37
0.38%
jan 1, 2009
96.466
-0.011
-0.01%
jan 1, 2010
93.755
-2.711
-2.81%
jan 1, 2011
96.209
+2.453
2.62%
jan 1, 2012
97.242
+1.033
1.07%
Ranking of countries by current statistics by years


Comments: