29
/
en
AIzaSyAYiBZKx7MnpbEhh9jyipgxe19OcubqV5w
April 1, 2024
35632
High income
HIC
false
2
1
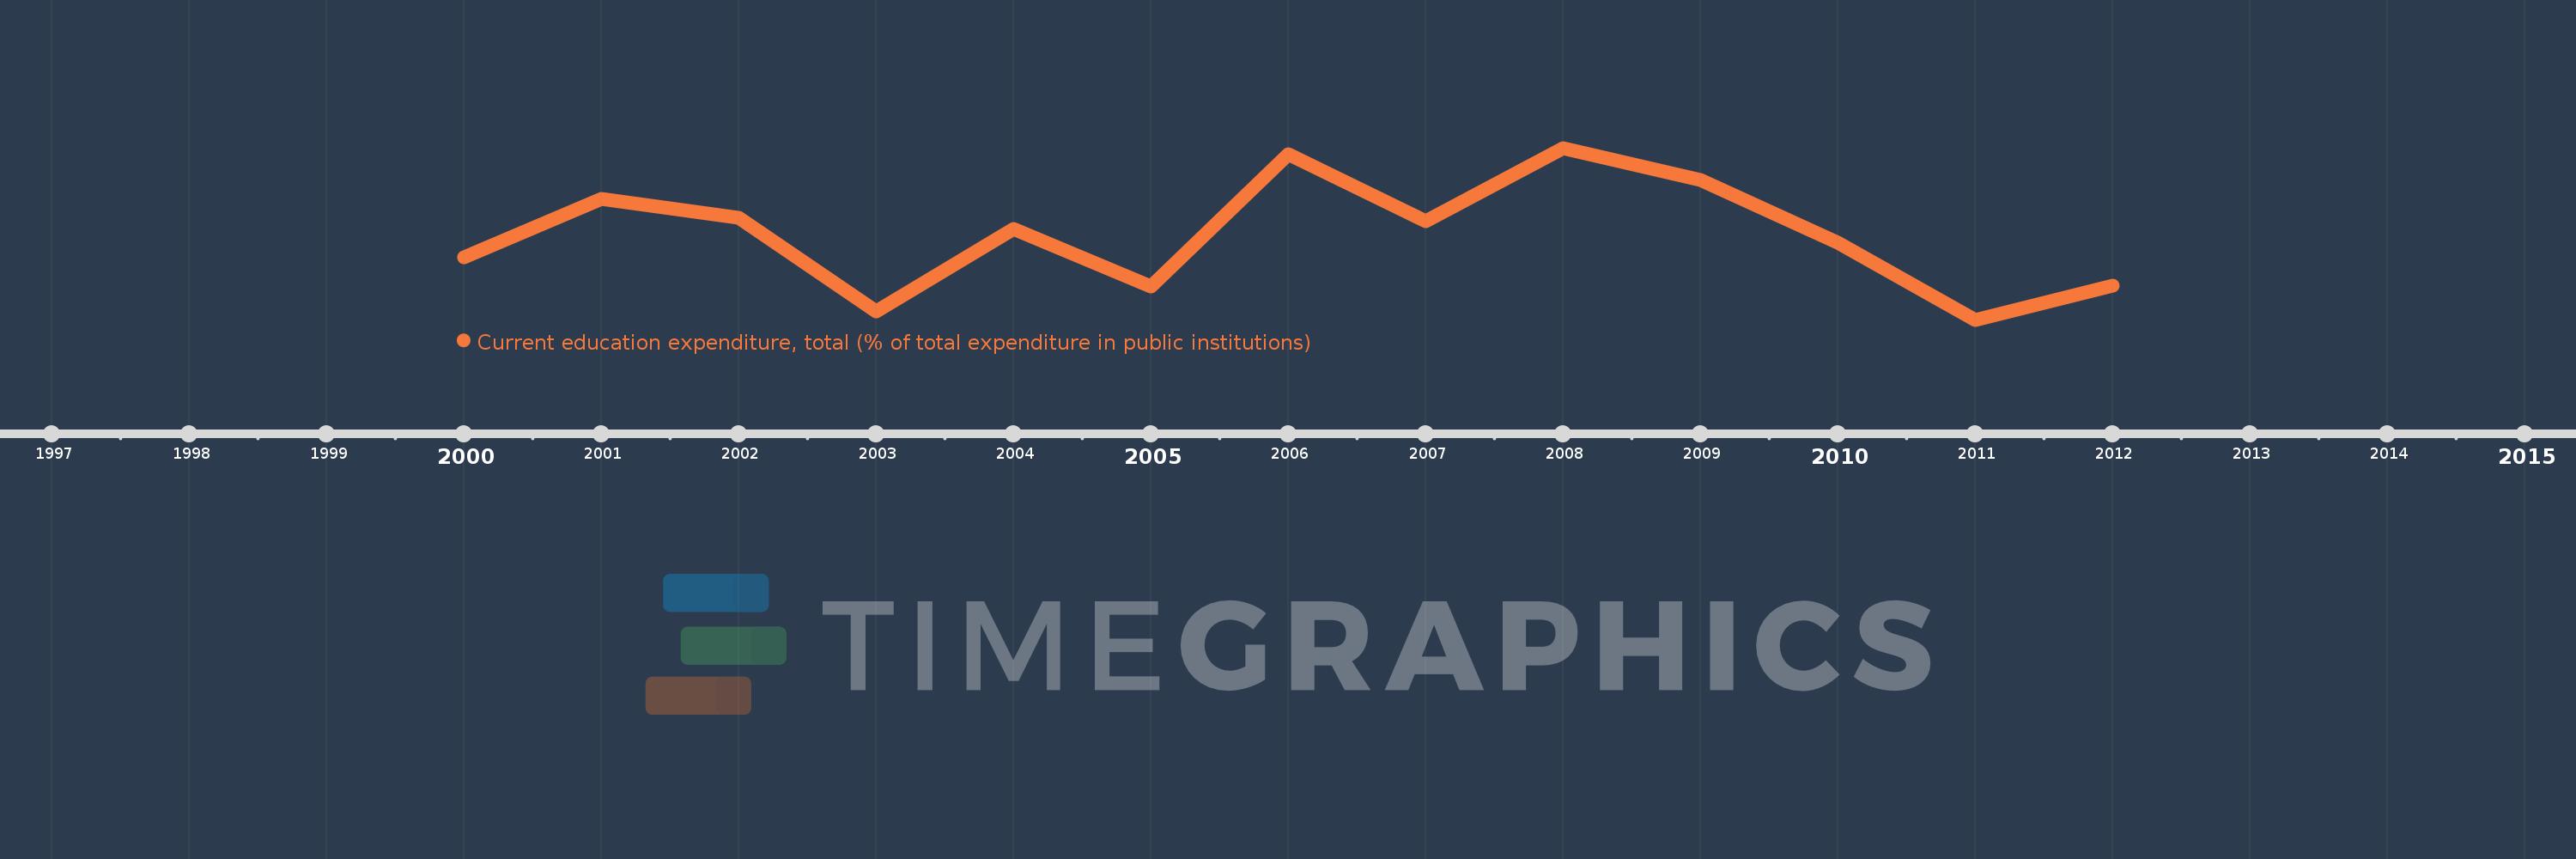
Current education expenditure, total (% of total expenditure in public institutions)
2012,2011,2010,2009,2008,2007,2006,2005,2004,2003,2002,2001,2000
This statistics in other country:
Timeline:
This timeline shows a graph from 2000 to 2012 of High income. No data until 1999. Number of actual observations by date: 13.
Source name:
World Development Indicators
Source organization:
United Nations Educational, Scientific, and Cultural Organization (UNESCO) Institute for Statistics.
Categories, topics:
Education
Last updated:
apr 23, 2017
Indicators value changes by year
Minimum:
90.643
jan 1, 2011
Maximum:
92.514
jan 1, 2008
At the date of observation
Value
Absolute change
Change from previous value
jan 1, 2000
91.327
+91.327
0.0%
jan 1, 2001
91.958
+0.631
0.69%
jan 1, 2002
91.755
-0.202
-0.22%
jan 1, 2003
90.733
-1.022
-1.11%
jan 1, 2004
91.635
+0.902
0.99%
jan 1, 2005
91.004
-0.631
-0.69%
jan 1, 2006
92.45
+1.446
1.59%
jan 1, 2007
91.713
-0.738
-0.8%
jan 1, 2008
92.514
+0.801
0.87%
jan 1, 2009
92.167
-0.346
-0.37%
jan 1, 2010
91.486
-0.681
-0.74%
jan 1, 2011
90.643
-0.843
-0.92%
jan 1, 2012
91.013
+0.37
0.41%
Ranking of countries by current statistics by years


Comments: