29
/
en
AIzaSyAYiBZKx7MnpbEhh9jyipgxe19OcubqV5w
April 1, 2024
89863
Botswana
BWA
true
2
1
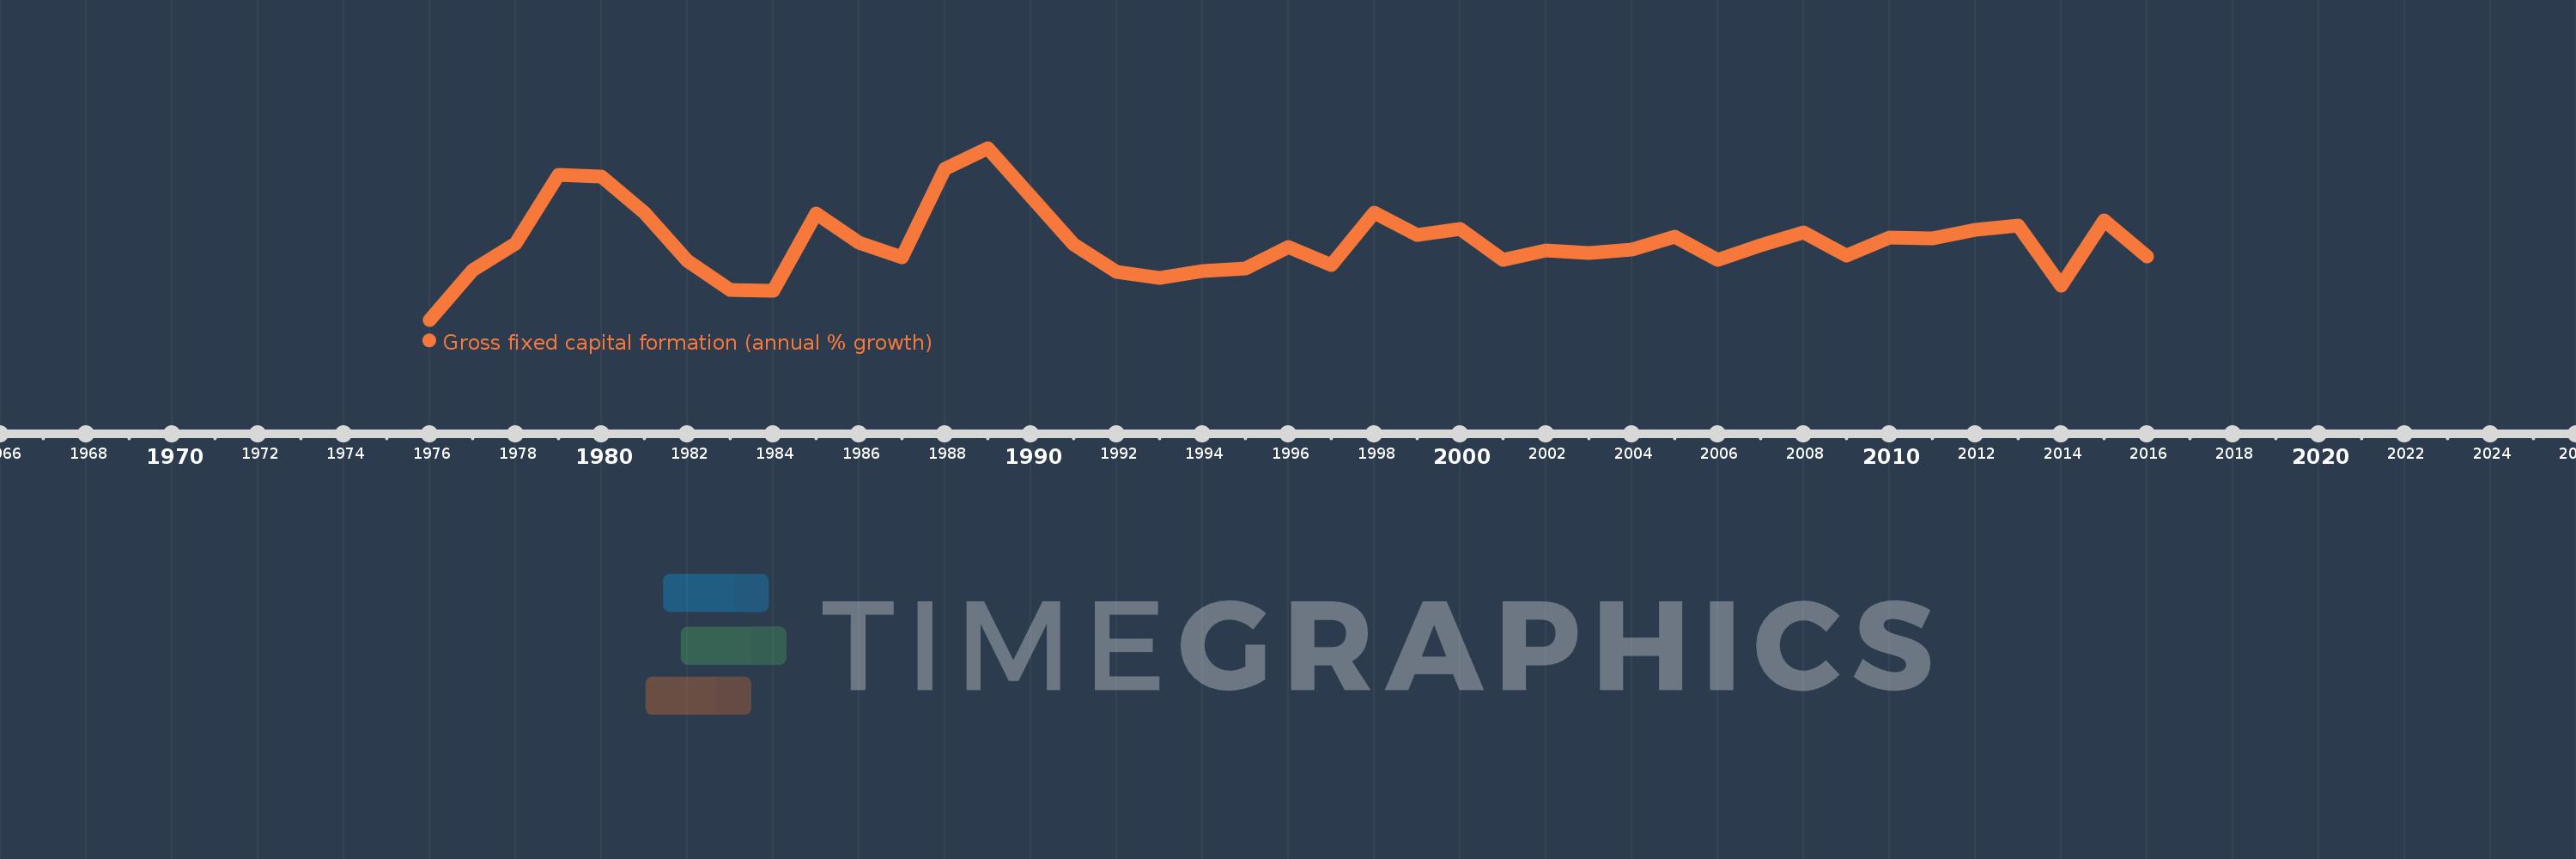
Gross fixed capital formation (annual % growth)
2016,2015,2014,2013,2012,2011,2010,2009,2008,2007,2006,2005,2004,2003,2002,2001,2000,1999,1998,1997,1996,1995,1994,1993,1992,1991,1990,1989,1988,1987,1986,1985,1984,1983,1982,1981,1980,1979,1978,1977,1976
This statistics in other country:
AlbaniaAlgeriaAntigua and BarbudaArab WorldArgentinaArmeniaAustraliaAustriaAzerbaijanBahamas, TheBahrainBangladeshBarbadosBelarusBelgiumBelizeBeninBhutanBoliviaBosnia and HerzegovinaBotswanaBrazilBrunei DarussalamBulgariaBurkina FasoBurundiCabo VerdeCambodiaCameroonCanadaCaribbean small statesCentral Europe and the BalticsChadChileChinaColombiaComorosCongo, Dem. Rep.Congo, Rep.Costa RicaCote d'IvoireCroatiaCubaCyprusCzech RepublicDenmarkDjiboutiDominican RepublicEarly-demographic dividendEast Asia & PacificEast Asia & Pacific (excluding high income)East Asia & Pacific (IDA & IBRD countries)EcuadorEgypt, Arab Rep.El SalvadorEquatorial GuineaEritreaEstoniaEthiopiaEuro areaEurope & Central AsiaEurope & Central Asia (excluding high income)Europe & Central Asia (IDA & IBRD countries)European UnionFinlandFranceGabonGambia, TheGeorgiaGermanyGhanaGreeceGuatemalaGuineaGuinea-BissauHaitiHeavily indebted poor countries (HIPC)High incomeHondurasHong Kong SAR, ChinaHungaryIBRD onlyIcelandIDA & IBRD totalIDA blendIDA onlyIDA totalIndiaIndonesiaIran, Islamic Rep.IrelandIsraelItalyJamaicaJapanJordanKazakhstanKenyaKorea, Rep.KosovoKyrgyz RepublicLao PDRLate-demographic dividendLatin America & Caribbean Latin America & Caribbean (excluding high income)Latin America & the Caribbean (IDA & IBRD countries)LatviaLeast developed countries: UN classificationLebanonLiberiaLithuaniaLow & middle incomeLow incomeLower middle incomeLuxembourgMacao SAR, ChinaMacedonia, FYRMadagascarMalawiMalaysiaMaliMaltaMauritaniaMauritiusMexicoMiddle East & North AfricaMiddle East & North Africa (excluding high income)Middle East & North Africa (IDA & IBRD countries)Middle incomeMoldovaMongoliaMontenegroMoroccoMozambiqueNamibiaNepalNetherlandsNew ZealandNicaraguaNigerNigeriaNorth AmericaNorwayOECD membersOmanPakistanPanamaPapua New GuineaParaguayPeruPhilippinesPolandPortugalPost-demographic dividendPre-demographic dividendPuerto RicoRomaniaRussian FederationRwandaSaudi ArabiaSenegalSerbiaSeychellesSierra LeoneSingaporeSlovak RepublicSloveniaSomaliaSouth AfricaSouth AsiaSouth Asia (IDA & IBRD)South SudanSpainSri LankaSub-Saharan Africa Sub-Saharan Africa (excluding high income)Sub-Saharan Africa (IDA & IBRD countries)SudanSurinameSwazilandSwedenSwitzerlandSyrian Arab RepublicTajikistanTanzaniaThailandTimor-LesteTogoTrinidad and TobagoTunisiaTurkeyUgandaUkraineUnited Arab EmiratesUnited KingdomUnited StatesUpper middle incomeUruguayUzbekistanVanuatuVenezuela, RBVietnamWest Bank and GazaWorldZimbabwe Timeline:
This timeline shows a graph from 1976 to 2016 of Botswana. No data until 1975. Number of actual observations by date: 41.
Source name:
World Development Indicators
Source organization:
World Bank national accounts data, and OECD National Accounts data files.
Categories, topics:
Economy & Growth
Last updated:
apr 23, 2017
Indicators value changes by year
Minimum:
-18.571
jan 1, 1976
Maximum:
40.195
jan 1, 1989
At the date of observation
Value
Absolute change
Change from previous value
jan 1, 1976
-18.571
-18.571
0.0%
jan 1, 1977
-1.584
+16.987
-91.47%
jan 1, 1978
7.417
+9.002
-568.13%
jan 1, 1979
30.975
+23.558
317.6%
jan 1, 1980
30.311
-0.664
-2.14%
jan 1, 1981
18.122
-12.189
-40.21%
jan 1, 1982
1.748
-16.374
-90.35%
jan 1, 1983
-8.446
-10.194
-583.2%
jan 1, 1984
-8.574
-0.128
1.52%
jan 1, 1985
17.65
+26.225
-305.85%
jan 1, 1986
7.795
-9.856
-55.84%
jan 1, 1987
2.716
-5.079
-65.15%
jan 1, 1988
33.082
+30.366
1.12K%
jan 1, 1989
40.195
+7.113
21.5%
jan 1, 1990
23.724
-16.471
-40.98%
jan 1, 1991
7.281
-16.442
-69.31%
jan 1, 1992
-2.239
-9.52
-130.75%
jan 1, 1993
-4.231
-1.992
88.98%
jan 1, 1994
-1.868
+2.363
-55.84%
jan 1, 1995
-1.174
+0.694
-37.15%
jan 1, 1996
6.234
+7.408
-630.9%
jan 1, 1997
0.151
-6.083
-97.58%
jan 1, 1998
18.095
+17.944
11.89K%
jan 1, 1999
10.363
-7.731
-42.73%
jan 1, 2000
12.476
+2.113
20.39%
jan 1, 2001
1.965
-10.511
-84.25%
jan 1, 2002
5.137
+3.172
161.47%
jan 1, 2003
4.162
-0.975
-18.98%
jan 1, 2004
5.424
+1.262
30.31%
jan 1, 2005
9.886
+4.462
82.28%
jan 1, 2006
1.863
-8.023
-81.16%
jan 1, 2007
6.953
+5.09
273.29%
jan 1, 2008
11.347
+4.395
63.21%
jan 1, 2009
3.334
-8.013
-70.61%
jan 1, 2010
9.49
+6.156
184.62%
jan 1, 2011
9.177
-0.314
-3.31%
jan 1, 2012
12.152
+2.975
32.42%
jan 1, 2013
13.615
+1.463
12.04%
jan 1, 2014
-6.83
-20.445
-150.17%
jan 1, 2015
15.3
+22.13
-324.01%
jan 1, 2016
2.998
-12.302
-80.41%
Ranking of countries by current statistics by years


Comments: