29
/
en
AIzaSyAYiBZKx7MnpbEhh9jyipgxe19OcubqV5w
April 1, 2024
91205
Brazil
BRA
true
2
1
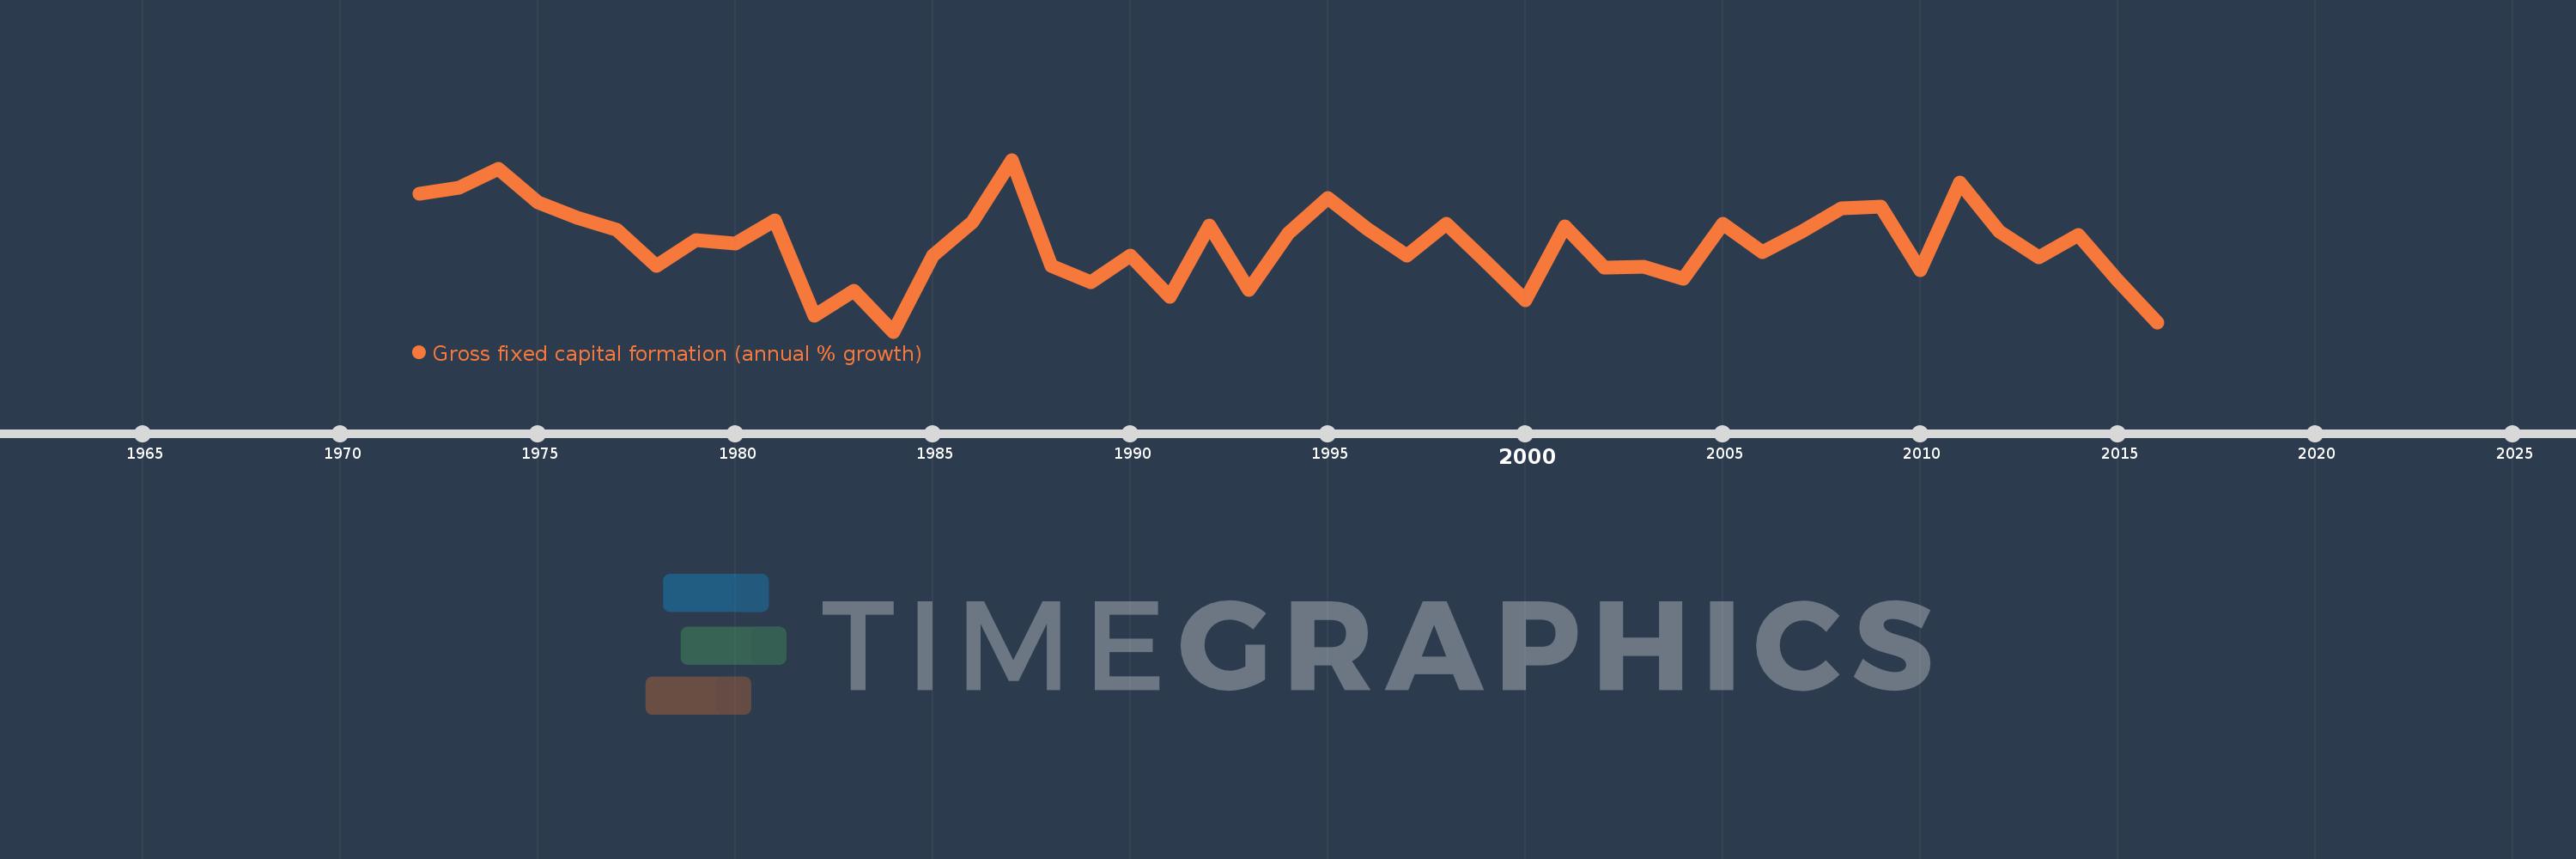
Gross fixed capital formation (annual % growth)
2016,2015,2014,2013,2012,2011,2010,2009,2008,2007,2006,2005,2004,2003,2002,2001,2000,1999,1998,1997,1996,1995,1994,1993,1992,1991,1990,1989,1988,1987,1986,1985,1984,1983,1982,1981,1980,1979,1978,1977,1976,1975,1974,1973,1972
This statistics in other country:
AlbaniaAlgeriaAntigua and BarbudaArab WorldArgentinaArmeniaAustraliaAustriaAzerbaijanBahamas, TheBahrainBangladeshBarbadosBelarusBelgiumBelizeBeninBhutanBoliviaBosnia and HerzegovinaBotswanaBrazilBrunei DarussalamBulgariaBurkina FasoBurundiCabo VerdeCambodiaCameroonCanadaCaribbean small statesCentral Europe and the BalticsChadChileChinaColombiaComorosCongo, Dem. Rep.Congo, Rep.Costa RicaCote d'IvoireCroatiaCubaCyprusCzech RepublicDenmarkDjiboutiDominican RepublicEarly-demographic dividendEast Asia & PacificEast Asia & Pacific (excluding high income)East Asia & Pacific (IDA & IBRD countries)EcuadorEgypt, Arab Rep.El SalvadorEquatorial GuineaEritreaEstoniaEthiopiaEuro areaEurope & Central AsiaEurope & Central Asia (excluding high income)Europe & Central Asia (IDA & IBRD countries)European UnionFinlandFranceGabonGambia, TheGeorgiaGermanyGhanaGreeceGuatemalaGuineaGuinea-BissauHaitiHeavily indebted poor countries (HIPC)High incomeHondurasHong Kong SAR, ChinaHungaryIBRD onlyIcelandIDA & IBRD totalIDA blendIDA onlyIDA totalIndiaIndonesiaIran, Islamic Rep.IrelandIsraelItalyJamaicaJapanJordanKazakhstanKenyaKorea, Rep.KosovoKyrgyz RepublicLao PDRLate-demographic dividendLatin America & Caribbean Latin America & Caribbean (excluding high income)Latin America & the Caribbean (IDA & IBRD countries)LatviaLeast developed countries: UN classificationLebanonLiberiaLithuaniaLow & middle incomeLow incomeLower middle incomeLuxembourgMacao SAR, ChinaMacedonia, FYRMadagascarMalawiMalaysiaMaliMaltaMauritaniaMauritiusMexicoMiddle East & North AfricaMiddle East & North Africa (excluding high income)Middle East & North Africa (IDA & IBRD countries)Middle incomeMoldovaMongoliaMontenegroMoroccoMozambiqueNamibiaNepalNetherlandsNew ZealandNicaraguaNigerNigeriaNorth AmericaNorwayOECD membersOmanPakistanPanamaPapua New GuineaParaguayPeruPhilippinesPolandPortugalPost-demographic dividendPre-demographic dividendPuerto RicoRomaniaRussian FederationRwandaSaudi ArabiaSenegalSerbiaSeychellesSierra LeoneSingaporeSlovak RepublicSloveniaSomaliaSouth AfricaSouth AsiaSouth Asia (IDA & IBRD)South SudanSpainSri LankaSub-Saharan Africa Sub-Saharan Africa (excluding high income)Sub-Saharan Africa (IDA & IBRD countries)SudanSurinameSwazilandSwedenSwitzerlandSyrian Arab RepublicTajikistanTanzaniaThailandTimor-LesteTogoTrinidad and TobagoTunisiaTurkeyUgandaUkraineUnited Arab EmiratesUnited KingdomUnited StatesUpper middle incomeUruguayUzbekistanVanuatuVenezuela, RBVietnamWest Bank and GazaWorldZimbabwe Timeline:
This timeline shows a graph from 1972 to 2016 of Brazil. No data until 1971. Number of actual observations by date: 45.
Source name:
World Development Indicators
Source organization:
World Bank national accounts data, and OECD National Accounts data files.
Categories, topics:
Economy & Growth
Last updated:
apr 23, 2017
Indicators value changes by year
Minimum:
-16.098
jan 1, 1984
At the date of observation
Value
Absolute change
Change from previous value
jan 1, 1972
15.348
+15.348
0.0%
jan 1, 1973
16.715
+1.366
8.9%
jan 1, 1974
20.991
+4.276
25.58%
jan 1, 1975
13.259
-7.732
-36.84%
jan 1, 1976
9.734
-3.524
-26.58%
jan 1, 1977
7.027
-2.707
-27.81%
jan 1, 1978
-1.171
-8.198
-116.66%
jan 1, 1979
4.748
+5.918
-505.56%
jan 1, 1980
3.886
-0.862
-18.16%
jan 1, 1981
9.172
+5.286
136.03%
jan 1, 1982
-12.39
-21.562
-235.1%
jan 1, 1983
-6.723
+5.667
-45.74%
jan 1, 1984
-16.098
-9.375
139.45%
jan 1, 1985
1.235
+17.333
-107.67%
jan 1, 1986
8.791
+7.556
612.06%
jan 1, 1987
22.98
+14.189
161.41%
jan 1, 1988
-1.139
-24.12
-104.96%
jan 1, 1989
-4.841
-3.701
324.81%
jan 1, 1990
1.211
+6.052
-125.02%
jan 1, 1991
-8.097
-9.308
-768.57%
jan 1, 1992
8.084
+16.181
-199.83%
jan 1, 1993
-6.621
-14.705
-181.91%
jan 1, 1994
6.326
+12.947
-195.54%
jan 1, 1995
14.257
+7.931
125.38%
jan 1, 1996
7.29
-6.967
-48.87%
jan 1, 1997
1.207
-6.083
-83.44%
jan 1, 1998
8.42
+7.213
597.46%
jan 1, 1999
-0.166
-8.586
-101.97%
jan 1, 2000
-8.873
-8.707
5.26K%
jan 1, 2001
7.801
+16.674
-187.92%
jan 1, 2002
-1.509
-9.31
-119.34%
jan 1, 2003
-1.439
+0.07
-4.64%
jan 1, 2004
-3.988
-2.549
177.16%
jan 1, 2005
8.485
+12.473
-312.78%
jan 1, 2006
1.956
-6.529
-76.95%
jan 1, 2007
6.664
+4.708
240.71%
jan 1, 2008
11.951
+5.287
79.33%
jan 1, 2009
12.286
+0.335
2.81%
jan 1, 2010
-2.133
-14.419
-117.36%
jan 1, 2011
17.853
+19.986
-937.09%
jan 1, 2012
6.703
-11.149
-62.45%
jan 1, 2013
0.752
-5.951
-88.77%
jan 1, 2014
5.827
+5.074
674.32%
jan 1, 2015
-4.482
-10.309
-176.93%
jan 1, 2016
-14.097
-9.615
214.52%
Ranking of countries by current statistics by years


Comments: