29
/
en
AIzaSyAYiBZKx7MnpbEhh9jyipgxe19OcubqV5w
April 1, 2024
134167
France
FRA
true
2
1
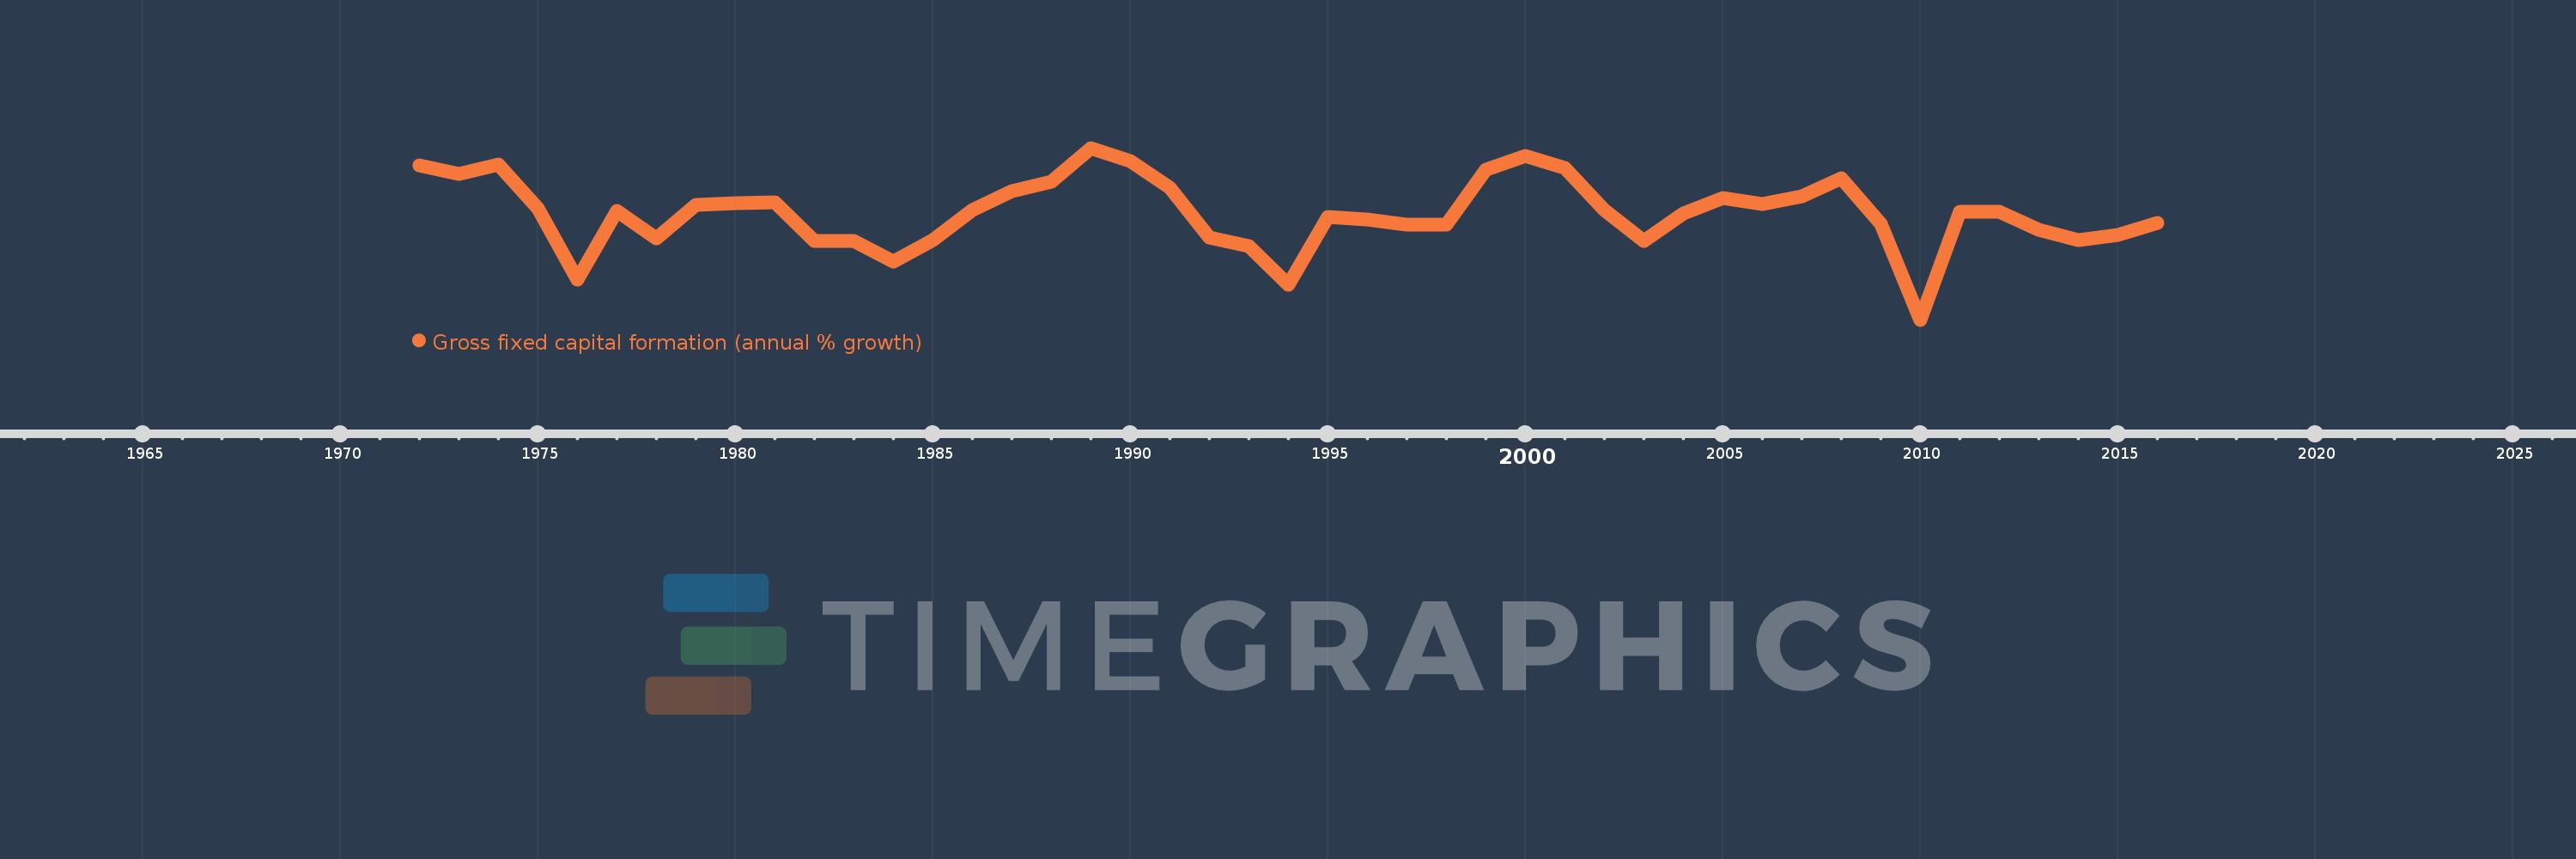
Gross fixed capital formation (annual % growth)
2016,2015,2014,2013,2012,2011,2010,2009,2008,2007,2006,2005,2004,2003,2002,2001,2000,1999,1998,1997,1996,1995,1994,1993,1992,1991,1990,1989,1988,1987,1986,1985,1984,1983,1982,1981,1980,1979,1978,1977,1976,1975,1974,1973,1972
This statistics in other country:
AlbaniaAlgeriaAntigua and BarbudaArab WorldArgentinaArmeniaAustraliaAustriaAzerbaijanBahamas, TheBahrainBangladeshBarbadosBelarusBelgiumBelizeBeninBhutanBoliviaBosnia and HerzegovinaBotswanaBrazilBrunei DarussalamBulgariaBurkina FasoBurundiCabo VerdeCambodiaCameroonCanadaCaribbean small statesCentral Europe and the BalticsChadChileChinaColombiaComorosCongo, Dem. Rep.Congo, Rep.Costa RicaCote d'IvoireCroatiaCubaCyprusCzech RepublicDenmarkDjiboutiDominican RepublicEarly-demographic dividendEast Asia & PacificEast Asia & Pacific (excluding high income)East Asia & Pacific (IDA & IBRD countries)EcuadorEgypt, Arab Rep.El SalvadorEquatorial GuineaEritreaEstoniaEthiopiaEuro areaEurope & Central AsiaEurope & Central Asia (excluding high income)Europe & Central Asia (IDA & IBRD countries)European UnionFinlandFranceGabonGambia, TheGeorgiaGermanyGhanaGreeceGuatemalaGuineaGuinea-BissauHaitiHeavily indebted poor countries (HIPC)High incomeHondurasHong Kong SAR, ChinaHungaryIBRD onlyIcelandIDA & IBRD totalIDA blendIDA onlyIDA totalIndiaIndonesiaIran, Islamic Rep.IrelandIsraelItalyJamaicaJapanJordanKazakhstanKenyaKorea, Rep.KosovoKyrgyz RepublicLao PDRLate-demographic dividendLatin America & Caribbean Latin America & Caribbean (excluding high income)Latin America & the Caribbean (IDA & IBRD countries)LatviaLeast developed countries: UN classificationLebanonLiberiaLithuaniaLow & middle incomeLow incomeLower middle incomeLuxembourgMacao SAR, ChinaMacedonia, FYRMadagascarMalawiMalaysiaMaliMaltaMauritaniaMauritiusMexicoMiddle East & North AfricaMiddle East & North Africa (excluding high income)Middle East & North Africa (IDA & IBRD countries)Middle incomeMoldovaMongoliaMontenegroMoroccoMozambiqueNamibiaNepalNetherlandsNew ZealandNicaraguaNigerNigeriaNorth AmericaNorwayOECD membersOmanPakistanPanamaPapua New GuineaParaguayPeruPhilippinesPolandPortugalPost-demographic dividendPre-demographic dividendPuerto RicoRomaniaRussian FederationRwandaSaudi ArabiaSenegalSerbiaSeychellesSierra LeoneSingaporeSlovak RepublicSloveniaSomaliaSouth AfricaSouth AsiaSouth Asia (IDA & IBRD)South SudanSpainSri LankaSub-Saharan Africa Sub-Saharan Africa (excluding high income)Sub-Saharan Africa (IDA & IBRD countries)SudanSurinameSwazilandSwedenSwitzerlandSyrian Arab RepublicTajikistanTanzaniaThailandTimor-LesteTogoTrinidad and TobagoTunisiaTurkeyUgandaUkraineUnited Arab EmiratesUnited KingdomUnited StatesUpper middle incomeUruguayUzbekistanVanuatuVenezuela, RBVietnamWest Bank and GazaWorldZimbabwe Timeline:
This timeline shows a graph from 1972 to 2016 of France. No data until 1971. Number of actual observations by date: 45.
Source name:
World Development Indicators
Source organization:
World Bank national accounts data, and OECD National Accounts data files.
Categories, topics:
Economy & Growth
Last updated:
apr 23, 2017
Indicators value changes by year
At the date of observation
Value
Absolute change
Change from previous value
jan 1, 1972
6.88
+6.88
0.0%
jan 1, 1973
5.988
-0.892
-12.96%
jan 1, 1974
6.935
+0.947
15.82%
jan 1, 1975
2.432
-4.503
-64.93%
jan 1, 1976
-4.913
-7.345
-302.02%
jan 1, 1977
2.222
+7.136
-145.24%
jan 1, 1978
-0.666
-2.889
-129.97%
jan 1, 1979
2.8
+3.466
-520.28%
jan 1, 1980
2.983
+0.184
6.56%
jan 1, 1981
3.067
+0.084
2.8%
jan 1, 1982
-0.96
-4.027
-131.31%
jan 1, 1983
-0.89
+0.07
-7.29%
jan 1, 1984
-3.028
-2.138
240.11%
jan 1, 1985
-0.837
+2.191
-72.36%
jan 1, 1986
2.307
+3.144
-375.68%
jan 1, 1987
4.184
+1.877
81.36%
jan 1, 1988
5.157
+0.972
23.23%
jan 1, 1989
8.688
+3.531
68.48%
jan 1, 1990
7.365
-1.322
-15.22%
jan 1, 1991
4.609
-2.756
-37.42%
jan 1, 1992
-0.534
-5.143
-111.59%
jan 1, 1993
-1.487
-0.952
178.27%
jan 1, 1994
-5.438
-3.951
265.77%
jan 1, 1995
1.555
+6.994
-128.6%
jan 1, 1996
1.329
-0.226
-14.53%
jan 1, 1997
0.752
-0.578
-43.46%
jan 1, 1998
0.789
+0.037
4.91%
jan 1, 1999
6.41
+5.621
712.88%
jan 1, 2000
7.841
+1.431
22.32%
jan 1, 2001
6.647
-1.194
-15.23%
jan 1, 2002
2.275
-4.372
-65.78%
jan 1, 2003
-0.917
-3.192
-140.33%
jan 1, 2004
1.919
+2.836
-309.18%
jan 1, 2005
3.48
+1.561
81.34%
jan 1, 2006
2.899
-0.581
-16.69%
jan 1, 2007
3.645
+0.746
25.73%
jan 1, 2008
5.535
+1.89
51.83%
jan 1, 2009
0.853
-4.682
-84.59%
jan 1, 2010
-9.07
-9.923
-1.16K%
jan 1, 2011
2.081
+11.151
-122.95%
jan 1, 2012
2.066
-0.015
-0.72%
jan 1, 2013
0.231
-1.835
-88.8%
jan 1, 2014
-0.806
-1.037
-448.04%
jan 1, 2015
-0.34
+0.465
-57.73%
jan 1, 2016
0.955
+1.296
-380.48%
Ranking of countries by current statistics by years


Comments: