29
/
en
AIzaSyAYiBZKx7MnpbEhh9jyipgxe19OcubqV5w
April 1, 2024
101145
Canada
CAN
true
2
1
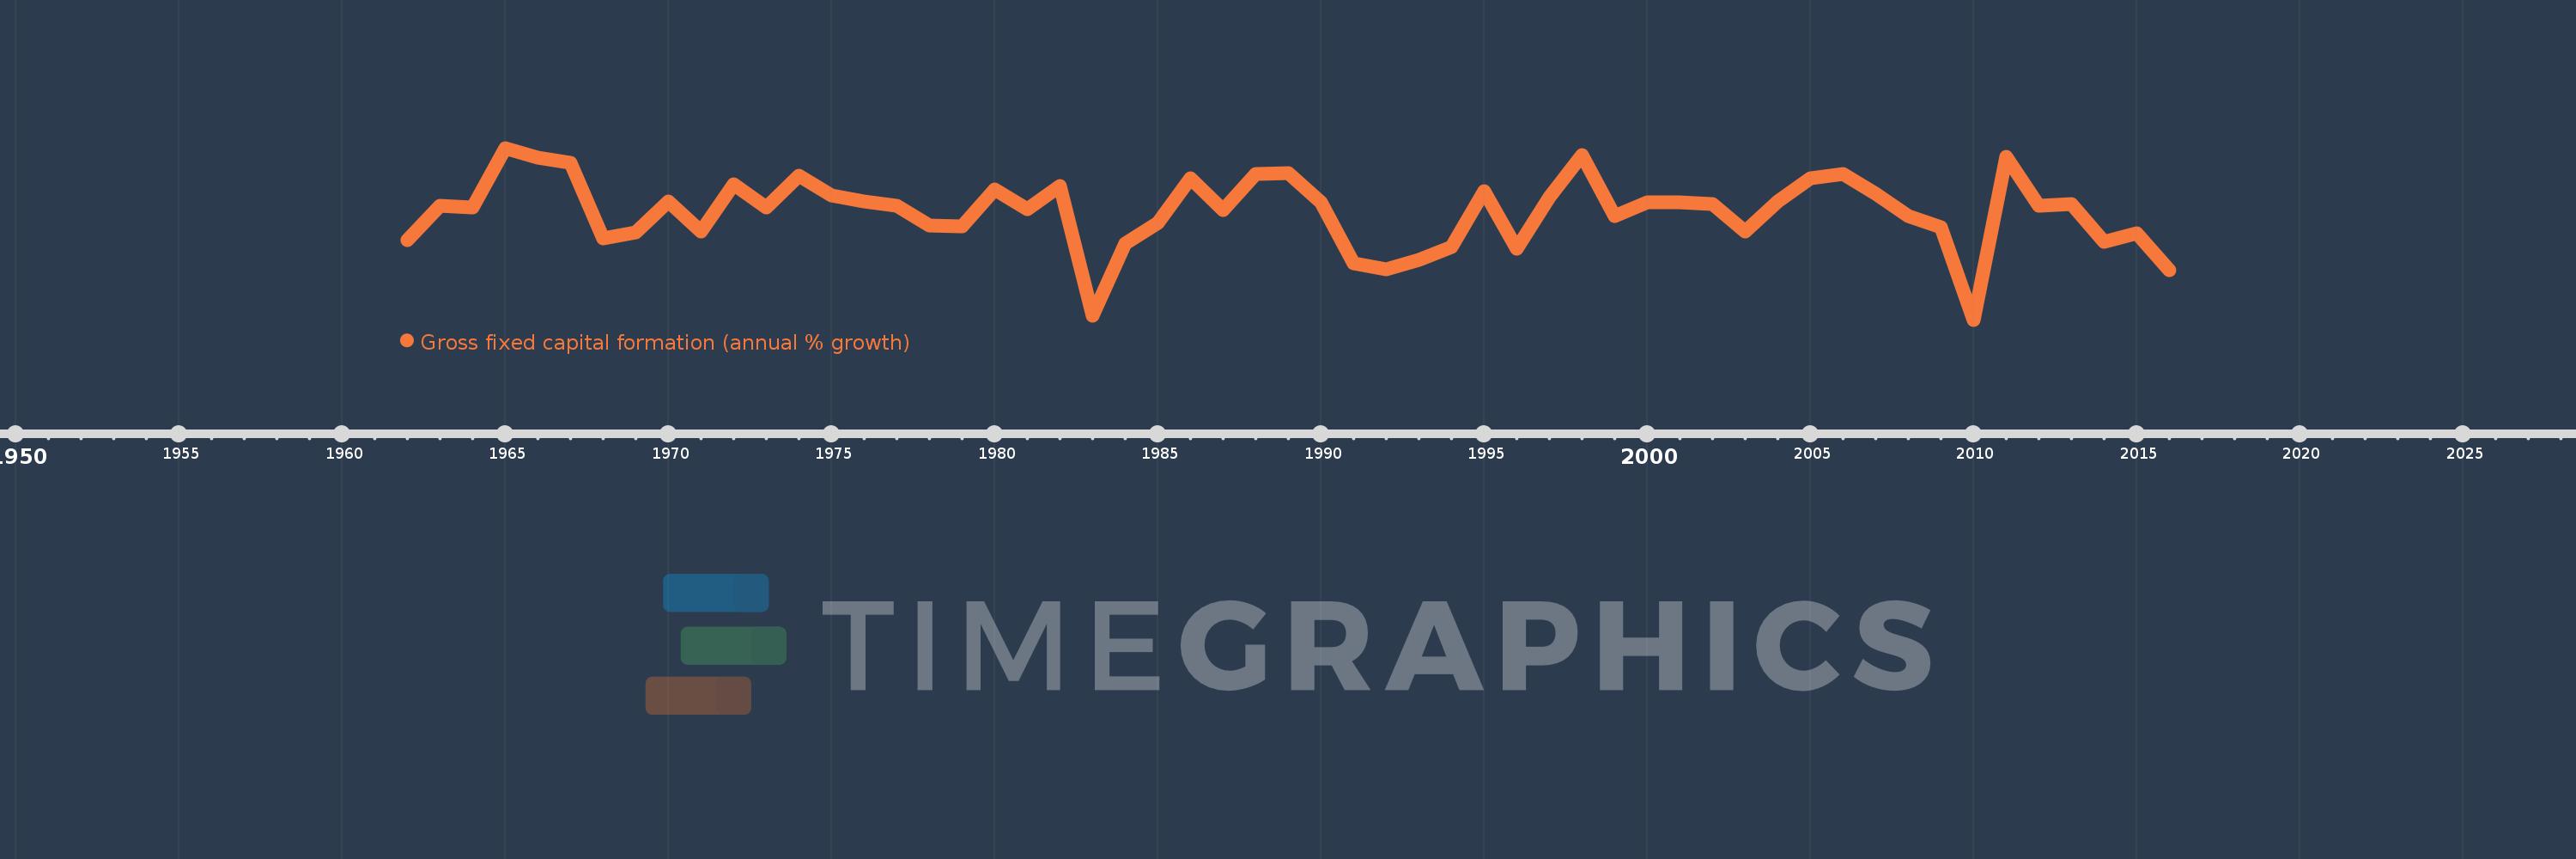
Gross fixed capital formation (annual % growth)
2016,2015,2014,2013,2012,2011,2010,2009,2008,2007,2006,2005,2004,2003,2002,2001,2000,1999,1998,1997,1996,1995,1994,1993,1992,1991,1990,1989,1988,1987,1986,1985,1984,1983,1982,1981,1980,1979,1978,1977,1976,1975,1974,1973,1972,1971,1970,1969,1968,1967,1966,1965,1964,1963,1962
This statistics in other country:
AlbaniaAlgeriaAntigua and BarbudaArab WorldArgentinaArmeniaAustraliaAustriaAzerbaijanBahamas, TheBahrainBangladeshBarbadosBelarusBelgiumBelizeBeninBhutanBoliviaBosnia and HerzegovinaBotswanaBrazilBrunei DarussalamBulgariaBurkina FasoBurundiCabo VerdeCambodiaCameroonCanadaCaribbean small statesCentral Europe and the BalticsChadChileChinaColombiaComorosCongo, Dem. Rep.Congo, Rep.Costa RicaCote d'IvoireCroatiaCubaCyprusCzech RepublicDenmarkDjiboutiDominican RepublicEarly-demographic dividendEast Asia & PacificEast Asia & Pacific (excluding high income)East Asia & Pacific (IDA & IBRD countries)EcuadorEgypt, Arab Rep.El SalvadorEquatorial GuineaEritreaEstoniaEthiopiaEuro areaEurope & Central AsiaEurope & Central Asia (excluding high income)Europe & Central Asia (IDA & IBRD countries)European UnionFinlandFranceGabonGambia, TheGeorgiaGermanyGhanaGreeceGuatemalaGuineaGuinea-BissauHaitiHeavily indebted poor countries (HIPC)High incomeHondurasHong Kong SAR, ChinaHungaryIBRD onlyIcelandIDA & IBRD totalIDA blendIDA onlyIDA totalIndiaIndonesiaIran, Islamic Rep.IrelandIsraelItalyJamaicaJapanJordanKazakhstanKenyaKorea, Rep.KosovoKyrgyz RepublicLao PDRLate-demographic dividendLatin America & Caribbean Latin America & Caribbean (excluding high income)Latin America & the Caribbean (IDA & IBRD countries)LatviaLeast developed countries: UN classificationLebanonLiberiaLithuaniaLow & middle incomeLow incomeLower middle incomeLuxembourgMacao SAR, ChinaMacedonia, FYRMadagascarMalawiMalaysiaMaliMaltaMauritaniaMauritiusMexicoMiddle East & North AfricaMiddle East & North Africa (excluding high income)Middle East & North Africa (IDA & IBRD countries)Middle incomeMoldovaMongoliaMontenegroMoroccoMozambiqueNamibiaNepalNetherlandsNew ZealandNicaraguaNigerNigeriaNorth AmericaNorwayOECD membersOmanPakistanPanamaPapua New GuineaParaguayPeruPhilippinesPolandPortugalPost-demographic dividendPre-demographic dividendPuerto RicoRomaniaRussian FederationRwandaSaudi ArabiaSenegalSerbiaSeychellesSierra LeoneSingaporeSlovak RepublicSloveniaSomaliaSouth AfricaSouth AsiaSouth Asia (IDA & IBRD)South SudanSpainSri LankaSub-Saharan Africa Sub-Saharan Africa (excluding high income)Sub-Saharan Africa (IDA & IBRD countries)SudanSurinameSwazilandSwedenSwitzerlandSyrian Arab RepublicTajikistanTanzaniaThailandTimor-LesteTogoTrinidad and TobagoTunisiaTurkeyUgandaUkraineUnited Arab EmiratesUnited KingdomUnited StatesUpper middle incomeUruguayUzbekistanVanuatuVenezuela, RBVietnamWest Bank and GazaWorldZimbabwe Timeline:
This timeline shows a graph from 1962 to 2016 of Canada. No data until 1961. Number of actual observations by date: 55.
Source name:
World Development Indicators
Source organization:
World Bank national accounts data, and OECD National Accounts data files.
Categories, topics:
Economy & Growth
Last updated:
apr 23, 2017
Indicators value changes by year
Minimum:
-11.314
jan 1, 2010
Maximum:
12.713
jan 1, 1965
At the date of observation
Value
Absolute change
Change from previous value
jan 1, 1962
-0.214
-0.214
0.0%
jan 1, 1963
4.619
+4.834
-2.25K%
jan 1, 1964
4.343
-0.276
-5.97%
jan 1, 1965
12.713
+8.369
192.69%
jan 1, 1966
11.371
-1.342
-10.56%
jan 1, 1967
10.576
-0.795
-6.99%
jan 1, 1968
0.109
-10.467
-98.97%
jan 1, 1969
0.929
+0.82
754.77%
jan 1, 1970
5.288
+4.36
469.51%
jan 1, 1971
1.041
-4.247
-80.32%
jan 1, 1972
7.667
+6.627
636.7%
jan 1, 1973
4.36
-3.308
-43.14%
jan 1, 1974
8.863
+4.503
103.3%
jan 1, 1975
6.127
-2.736
-30.87%
jan 1, 1976
5.232
-0.894
-14.6%
jan 1, 1977
4.636
-0.596
-11.39%
jan 1, 1978
1.866
-2.77
-59.75%
jan 1, 1979
1.739
-0.127
-6.81%
jan 1, 1980
6.945
+5.205
299.25%
jan 1, 1981
4.165
-2.78
-40.02%
jan 1, 1982
7.443
+3.278
78.69%
jan 1, 1983
-10.806
-18.249
-245.19%
jan 1, 1984
-0.666
+10.14
-93.84%
jan 1, 1985
2.195
+2.862
-429.58%
jan 1, 1986
8.473
+6.278
285.95%
jan 1, 1987
3.97
-4.503
-53.15%
jan 1, 1988
9.079
+5.109
128.69%
jan 1, 1989
9.136
+0.057
0.63%
jan 1, 1990
5.151
-3.986
-43.63%
jan 1, 1991
-3.481
-8.631
-167.58%
jan 1, 1992
-4.224
-0.743
21.35%
jan 1, 1993
-2.942
+1.282
-30.34%
jan 1, 1994
-1.163
+1.78
-60.48%
jan 1, 1995
6.703
+7.866
-676.57%
jan 1, 1996
-1.365
-8.068
-120.37%
jan 1, 1997
5.772
+7.137
-522.81%
jan 1, 1998
11.677
+5.905
102.31%
jan 1, 1999
3.235
-8.442
-72.29%
jan 1, 2000
5.133
+1.898
58.65%
jan 1, 2001
5.064
-0.069
-1.34%
jan 1, 2002
4.82
-0.245
-4.83%
jan 1, 2003
0.996
-3.824
-79.33%
jan 1, 2004
5.219
+4.223
424.03%
jan 1, 2005
8.434
+3.214
61.58%
jan 1, 2006
9.125
+0.691
8.2%
jan 1, 2007
6.28
-2.845
-31.18%
jan 1, 2008
3.168
-3.112
-49.56%
jan 1, 2009
1.627
-1.541
-48.65%
jan 1, 2010
-11.314
-12.94
-795.58%
jan 1, 2011
11.51
+22.824
-201.74%
jan 1, 2012
4.638
-6.873
-59.71%
jan 1, 2013
4.889
+0.251
5.41%
jan 1, 2014
-0.455
-5.343
-109.3%
jan 1, 2015
0.747
+1.201
-264.29%
jan 1, 2016
-4.375
-5.121
-685.85%
Ranking of countries by current statistics by years


Comments: