29
/
en
AIzaSyAYiBZKx7MnpbEhh9jyipgxe19OcubqV5w
April 1, 2024
62642
World
WLD
false
2
1
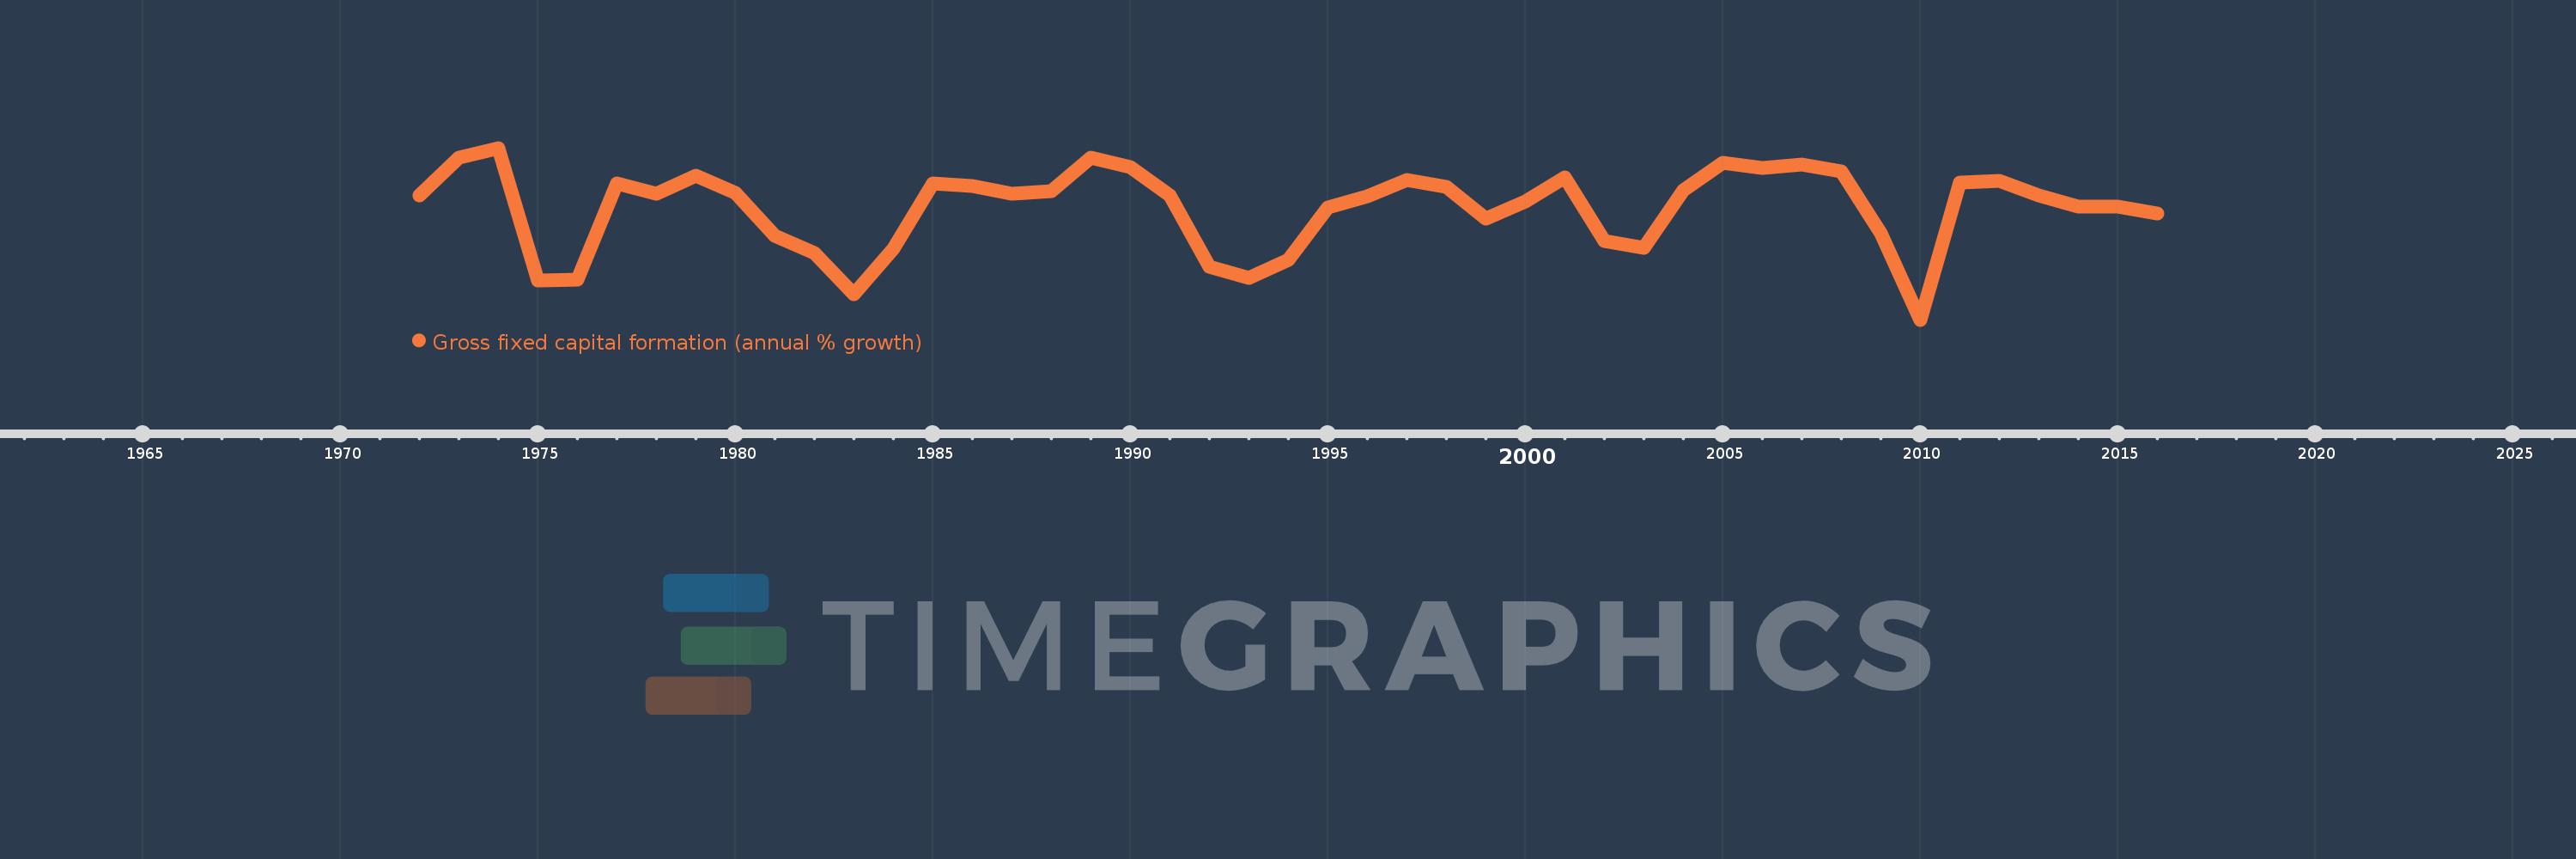
Gross fixed capital formation (annual % growth)
2016,2015,2014,2013,2012,2011,2010,2009,2008,2007,2006,2005,2004,2003,2002,2001,2000,1999,1998,1997,1996,1995,1994,1993,1992,1991,1990,1989,1988,1987,1986,1985,1984,1983,1982,1981,1980,1979,1978,1977,1976,1975,1974,1973,1972
This statistics in other country:
AlbaniaAlgeriaAntigua and BarbudaArab WorldArgentinaArmeniaAustraliaAustriaAzerbaijanBahamas, TheBahrainBangladeshBarbadosBelarusBelgiumBelizeBeninBhutanBoliviaBosnia and HerzegovinaBotswanaBrazilBrunei DarussalamBulgariaBurkina FasoBurundiCabo VerdeCambodiaCameroonCanadaCaribbean small statesCentral Europe and the BalticsChadChileChinaColombiaComorosCongo, Dem. Rep.Congo, Rep.Costa RicaCote d'IvoireCroatiaCubaCyprusCzech RepublicDenmarkDjiboutiDominican RepublicEarly-demographic dividendEast Asia & PacificEast Asia & Pacific (excluding high income)East Asia & Pacific (IDA & IBRD countries)EcuadorEgypt, Arab Rep.El SalvadorEquatorial GuineaEritreaEstoniaEthiopiaEuro areaEurope & Central AsiaEurope & Central Asia (excluding high income)Europe & Central Asia (IDA & IBRD countries)European UnionFinlandFranceGabonGambia, TheGeorgiaGermanyGhanaGreeceGuatemalaGuineaGuinea-BissauHaitiHeavily indebted poor countries (HIPC)High incomeHondurasHong Kong SAR, ChinaHungaryIBRD onlyIcelandIDA & IBRD totalIDA blendIDA onlyIDA totalIndiaIndonesiaIran, Islamic Rep.IrelandIsraelItalyJamaicaJapanJordanKazakhstanKenyaKorea, Rep.KosovoKyrgyz RepublicLao PDRLate-demographic dividendLatin America & Caribbean Latin America & Caribbean (excluding high income)Latin America & the Caribbean (IDA & IBRD countries)LatviaLeast developed countries: UN classificationLebanonLiberiaLithuaniaLow & middle incomeLow incomeLower middle incomeLuxembourgMacao SAR, ChinaMacedonia, FYRMadagascarMalawiMalaysiaMaliMaltaMauritaniaMauritiusMexicoMiddle East & North AfricaMiddle East & North Africa (excluding high income)Middle East & North Africa (IDA & IBRD countries)Middle incomeMoldovaMongoliaMontenegroMoroccoMozambiqueNamibiaNepalNetherlandsNew ZealandNicaraguaNigerNigeriaNorth AmericaNorwayOECD membersOmanPakistanPanamaPapua New GuineaParaguayPeruPhilippinesPolandPortugalPost-demographic dividendPre-demographic dividendPuerto RicoRomaniaRussian FederationRwandaSaudi ArabiaSenegalSerbiaSeychellesSierra LeoneSingaporeSlovak RepublicSloveniaSomaliaSouth AfricaSouth AsiaSouth Asia (IDA & IBRD)South SudanSpainSri LankaSub-Saharan Africa Sub-Saharan Africa (excluding high income)Sub-Saharan Africa (IDA & IBRD countries)SudanSurinameSwazilandSwedenSwitzerlandSyrian Arab RepublicTajikistanTanzaniaThailandTimor-LesteTogoTrinidad and TobagoTunisiaTurkeyUgandaUkraineUnited Arab EmiratesUnited KingdomUnited StatesUpper middle incomeUruguayUzbekistanVanuatuVenezuela, RBVietnamWest Bank and GazaWorldZimbabwe Timeline:
This timeline shows a graph from 1972 to 2016 of World. No data until 1971. Number of actual observations by date: 45.
Source name:
World Development Indicators
Source organization:
World Bank national accounts data, and OECD National Accounts data files.
Categories, topics:
Economy & Growth
Last updated:
apr 23, 2017
Indicators value changes by year
Minimum:
-4.662
jan 1, 2010
At the date of observation
Value
Absolute change
Change from previous value
jan 1, 1972
4.08
+4.08
0.0%
jan 1, 1973
6.782
+2.702
66.23%
jan 1, 1974
7.447
+0.666
9.81%
jan 1, 1975
-1.872
-9.319
-125.14%
jan 1, 1976
-1.828
+0.044
-2.34%
jan 1, 1977
4.917
+6.745
-368.99%
jan 1, 1978
4.19
-0.727
-14.78%
jan 1, 1979
5.521
+1.331
31.75%
jan 1, 1980
4.28
-1.241
-22.48%
jan 1, 1981
1.24
-3.04
-71.02%
jan 1, 1982
0.048
-1.192
-96.14%
jan 1, 1983
-2.86
-2.908
-6.07K%
jan 1, 1984
0.344
+3.204
-112.03%
jan 1, 1985
4.932
+4.588
1.33K%
jan 1, 1986
4.789
-0.143
-2.9%
jan 1, 1987
4.206
-0.583
-12.17%
jan 1, 1988
4.378
+0.171
4.07%
jan 1, 1989
6.77
+2.393
54.65%
jan 1, 1990
6.098
-0.672
-9.93%
jan 1, 1991
4.089
-2.009
-32.95%
jan 1, 1992
-0.941
-5.03
-123.01%
jan 1, 1993
-1.717
-0.777
82.53%
jan 1, 1994
-0.444
+1.274
-74.16%
jan 1, 1995
3.243
+3.686
-830.8%
jan 1, 1996
4.026
+0.784
24.17%
jan 1, 1997
5.159
+1.132
28.12%
jan 1, 1998
4.711
-0.447
-8.67%
jan 1, 1999
2.481
-2.231
-47.35%
jan 1, 2000
3.695
+1.215
48.98%
jan 1, 2001
5.395
+1.7
46.0%
jan 1, 2002
0.903
-4.493
-83.27%
jan 1, 2003
0.393
-0.51
-56.51%
jan 1, 2004
4.466
+4.074
1.04K%
jan 1, 2005
6.429
+1.962
43.94%
jan 1, 2006
6.065
-0.363
-5.65%
jan 1, 2007
6.258
+0.192
3.17%
jan 1, 2008
5.767
-0.491
-7.84%
jan 1, 2009
1.428
-4.338
-75.23%
jan 1, 2010
-4.662
-6.09
-426.37%
jan 1, 2011
5.036
+9.698
-208.02%
jan 1, 2012
5.154
+0.119
2.35%
jan 1, 2013
4.123
-1.031
-20.01%
jan 1, 2014
3.341
-0.782
-18.97%
jan 1, 2015
3.32
-0.021
-0.62%
jan 1, 2016
2.857
-0.463
-13.96%
Ranking of countries by current statistics by years


Comments: