29
/
en
AIzaSyAYiBZKx7MnpbEhh9jyipgxe19OcubqV5w
April 1, 2024
248773
Sri Lanka
LKA
true
2
1
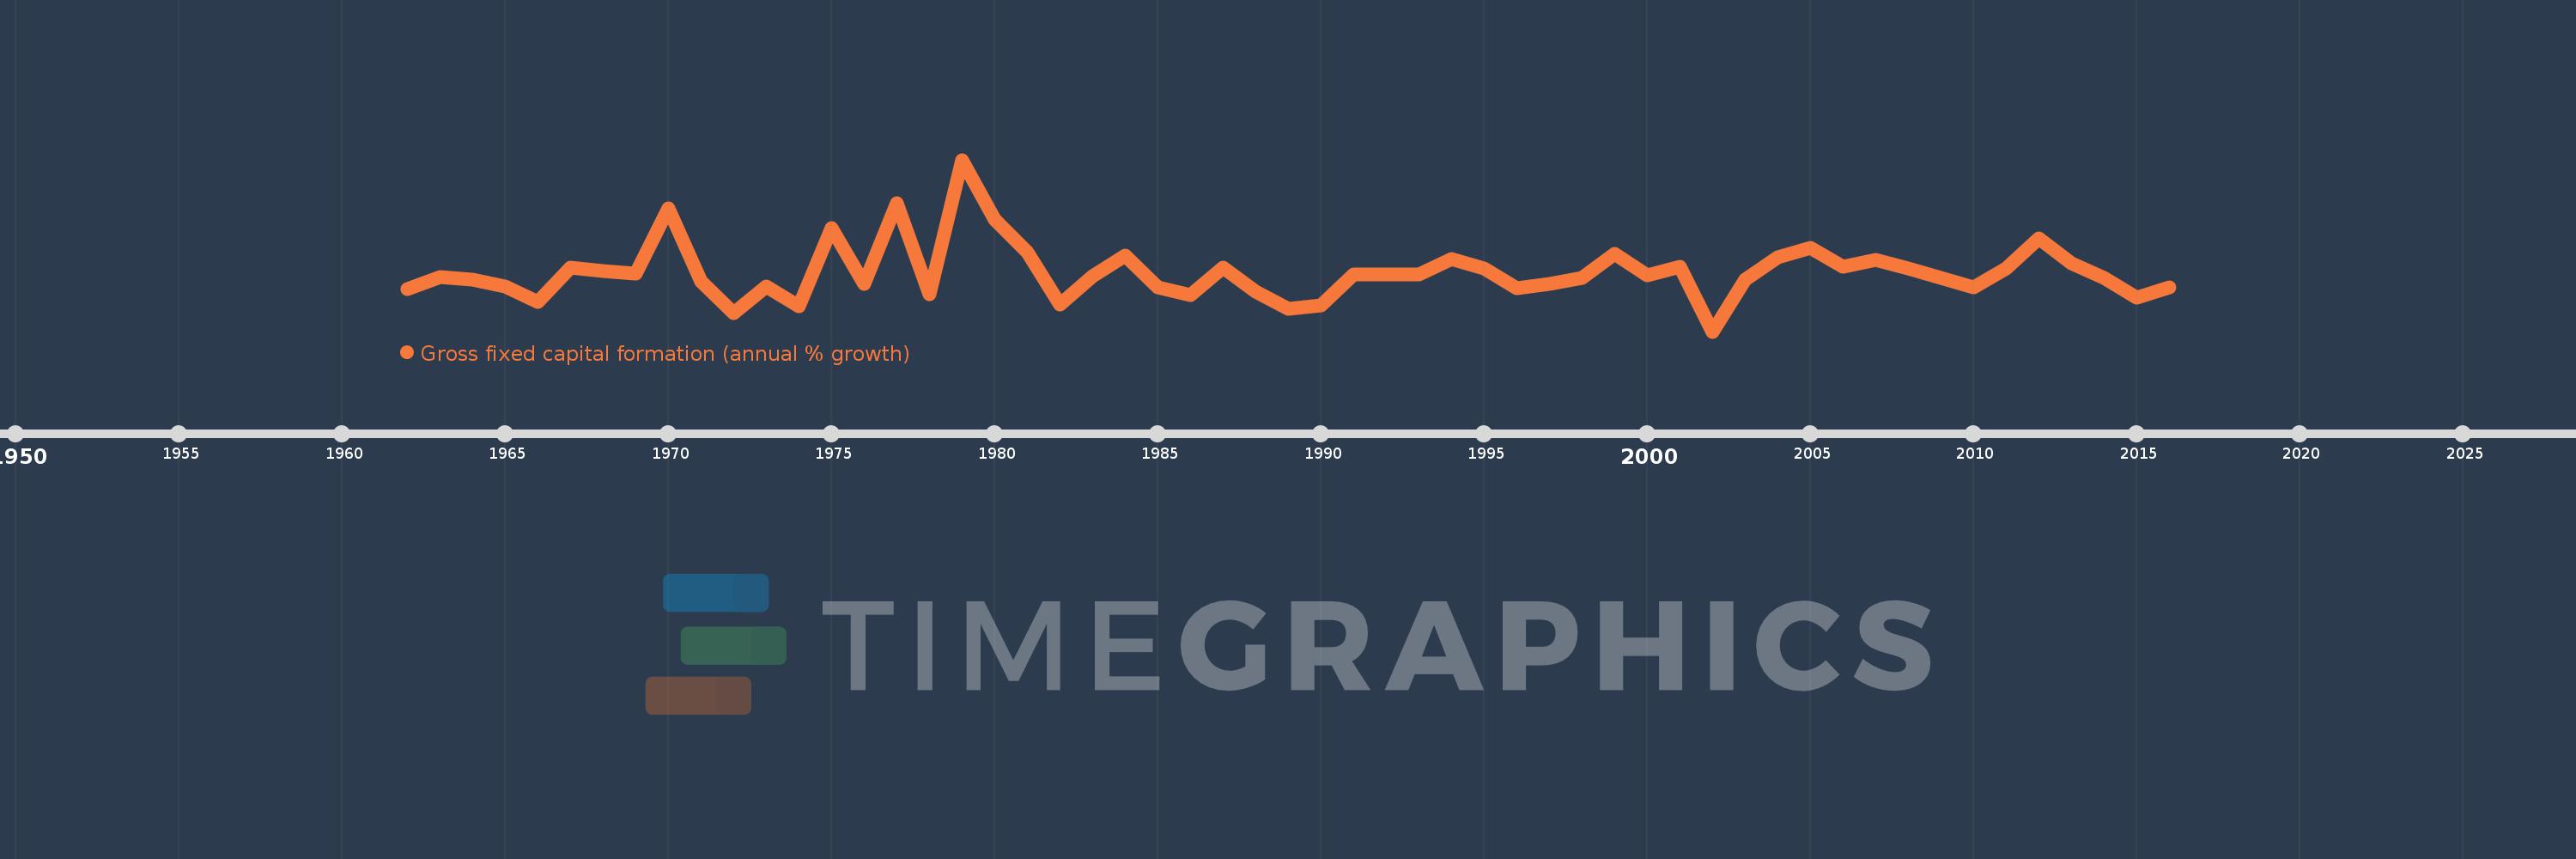
Gross fixed capital formation (annual % growth)
2016,2015,2014,2013,2012,2011,2010,2009,2008,2007,2006,2005,2004,2003,2002,2001,2000,1999,1998,1997,1996,1995,1994,1993,1992,1991,1990,1989,1988,1987,1986,1985,1984,1983,1982,1981,1980,1979,1978,1977,1976,1975,1974,1973,1972,1971,1970,1969,1968,1967,1966,1965,1964,1963,1962
This statistics in other country:
AlbaniaAlgeriaAntigua and BarbudaArab WorldArgentinaArmeniaAustraliaAustriaAzerbaijanBahamas, TheBahrainBangladeshBarbadosBelarusBelgiumBelizeBeninBhutanBoliviaBosnia and HerzegovinaBotswanaBrazilBrunei DarussalamBulgariaBurkina FasoBurundiCabo VerdeCambodiaCameroonCanadaCaribbean small statesCentral Europe and the BalticsChadChileChinaColombiaComorosCongo, Dem. Rep.Congo, Rep.Costa RicaCote d'IvoireCroatiaCubaCyprusCzech RepublicDenmarkDjiboutiDominican RepublicEarly-demographic dividendEast Asia & PacificEast Asia & Pacific (excluding high income)East Asia & Pacific (IDA & IBRD countries)EcuadorEgypt, Arab Rep.El SalvadorEquatorial GuineaEritreaEstoniaEthiopiaEuro areaEurope & Central AsiaEurope & Central Asia (excluding high income)Europe & Central Asia (IDA & IBRD countries)European UnionFinlandFranceGabonGambia, TheGeorgiaGermanyGhanaGreeceGuatemalaGuineaGuinea-BissauHaitiHeavily indebted poor countries (HIPC)High incomeHondurasHong Kong SAR, ChinaHungaryIBRD onlyIcelandIDA & IBRD totalIDA blendIDA onlyIDA totalIndiaIndonesiaIran, Islamic Rep.IrelandIsraelItalyJamaicaJapanJordanKazakhstanKenyaKorea, Rep.KosovoKyrgyz RepublicLao PDRLate-demographic dividendLatin America & Caribbean Latin America & Caribbean (excluding high income)Latin America & the Caribbean (IDA & IBRD countries)LatviaLeast developed countries: UN classificationLebanonLiberiaLithuaniaLow & middle incomeLow incomeLower middle incomeLuxembourgMacao SAR, ChinaMacedonia, FYRMadagascarMalawiMalaysiaMaliMaltaMauritaniaMauritiusMexicoMiddle East & North AfricaMiddle East & North Africa (excluding high income)Middle East & North Africa (IDA & IBRD countries)Middle incomeMoldovaMongoliaMontenegroMoroccoMozambiqueNamibiaNepalNetherlandsNew ZealandNicaraguaNigerNigeriaNorth AmericaNorwayOECD membersOmanPakistanPanamaPapua New GuineaParaguayPeruPhilippinesPolandPortugalPost-demographic dividendPre-demographic dividendPuerto RicoRomaniaRussian FederationRwandaSaudi ArabiaSenegalSerbiaSeychellesSierra LeoneSingaporeSlovak RepublicSloveniaSomaliaSouth AfricaSouth AsiaSouth Asia (IDA & IBRD)South SudanSpainSri LankaSub-Saharan Africa Sub-Saharan Africa (excluding high income)Sub-Saharan Africa (IDA & IBRD countries)SudanSurinameSwazilandSwedenSwitzerlandSyrian Arab RepublicTajikistanTanzaniaThailandTimor-LesteTogoTrinidad and TobagoTunisiaTurkeyUgandaUkraineUnited Arab EmiratesUnited KingdomUnited StatesUpper middle incomeUruguayUzbekistanVanuatuVenezuela, RBVietnamWest Bank and GazaWorldZimbabwe Timeline:
This timeline shows a graph from 1962 to 2016 of Sri Lanka. No data until 1961. Number of actual observations by date: 55.
Source name:
World Development Indicators
Source organization:
World Bank national accounts data, and OECD National Accounts data files.
Categories, topics:
Economy & Growth
Last updated:
apr 23, 2017
Indicators value changes by year
Minimum:
-17.471
jan 1, 2002
Maximum:
54.906
jan 1, 1979
At the date of observation
Value
Absolute change
Change from previous value
jan 1, 1962
0.483
+0.483
0.0%
jan 1, 1963
5.406
+4.923
1.02K%
jan 1, 1964
4.317
-1.088
-20.14%
jan 1, 1965
1.549
-2.768
-64.11%
jan 1, 1966
-5.092
-6.641
-428.66%
jan 1, 1967
9.607
+14.699
-288.66%
jan 1, 1968
8.162
-1.445
-15.04%
jan 1, 1969
6.996
-1.166
-14.29%
jan 1, 1970
34.433
+27.438
392.2%
jan 1, 1971
3.853
-30.58
-88.81%
jan 1, 1972
-9.555
-13.408
-347.98%
jan 1, 1973
1.566
+11.12
-116.39%
jan 1, 1974
-6.62
-8.185
-522.8%
jan 1, 1975
26.286
+32.906
-497.09%
jan 1, 1976
2.731
-23.555
-89.61%
jan 1, 1977
36.529
+33.798
1.24K%
jan 1, 1978
-1.559
-38.088
-104.27%
jan 1, 1979
54.906
+56.465
-3.62K%
jan 1, 1980
29.876
-25.03
-45.59%
jan 1, 1981
16.021
-13.856
-46.38%
jan 1, 1982
-6.126
-22.147
-138.24%
jan 1, 1983
6.021
+12.147
-198.28%
jan 1, 1984
14.589
+8.568
142.3%
jan 1, 1985
1.198
-13.391
-91.79%
jan 1, 1986
-2.003
-3.2
-267.23%
jan 1, 1987
9.523
+11.525
-575.49%
jan 1, 1988
-0.5
-10.023
-105.25%
jan 1, 1989
-7.709
-7.208
1.44K%
jan 1, 1990
-6.345
+1.363
-17.68%
jan 1, 1991
6.6
+12.945
-204.01%
jan 1, 1994
13.0
+6.4
96.97%
jan 1, 1995
9.0
-4.0
-30.77%
jan 1, 1996
0.951
-8.049
-89.43%
jan 1, 1997
2.458
+1.507
158.36%
jan 1, 1998
5.117
+2.659
108.2%
jan 1, 1999
15.265
+10.147
198.29%
jan 1, 2000
6.411
-8.854
-58.0%
jan 1, 2001
9.955
+3.544
55.28%
jan 1, 2002
-17.471
-27.426
-275.5%
jan 1, 2003
4.421
+21.891
-125.3%
jan 1, 2004
13.817
+9.396
212.56%
jan 1, 2005
17.844
+4.027
29.15%
jan 1, 2006
9.812
-8.032
-45.01%
jan 1, 2007
12.871
+3.059
31.18%
jan 1, 2008
9.143
-3.727
-28.96%
jan 1, 2009
5.297
-3.847
-42.07%
jan 1, 2010
1.344
-3.953
-74.63%
jan 1, 2011
9.167
+7.823
582.06%
jan 1, 2012
21.627
+12.459
135.91%
jan 1, 2013
11.474
-10.153
-46.95%
jan 1, 2014
5.048
-6.425
-56.0%
jan 1, 2015
-3.185
-8.233
-163.09%
jan 1, 2016
1.047
+4.232
-132.87%
Ranking of countries by current statistics by years


Comments: