29
/
en
AIzaSyAYiBZKx7MnpbEhh9jyipgxe19OcubqV5w
April 1, 2024
207998
Netherlands
NLD
true
2
1
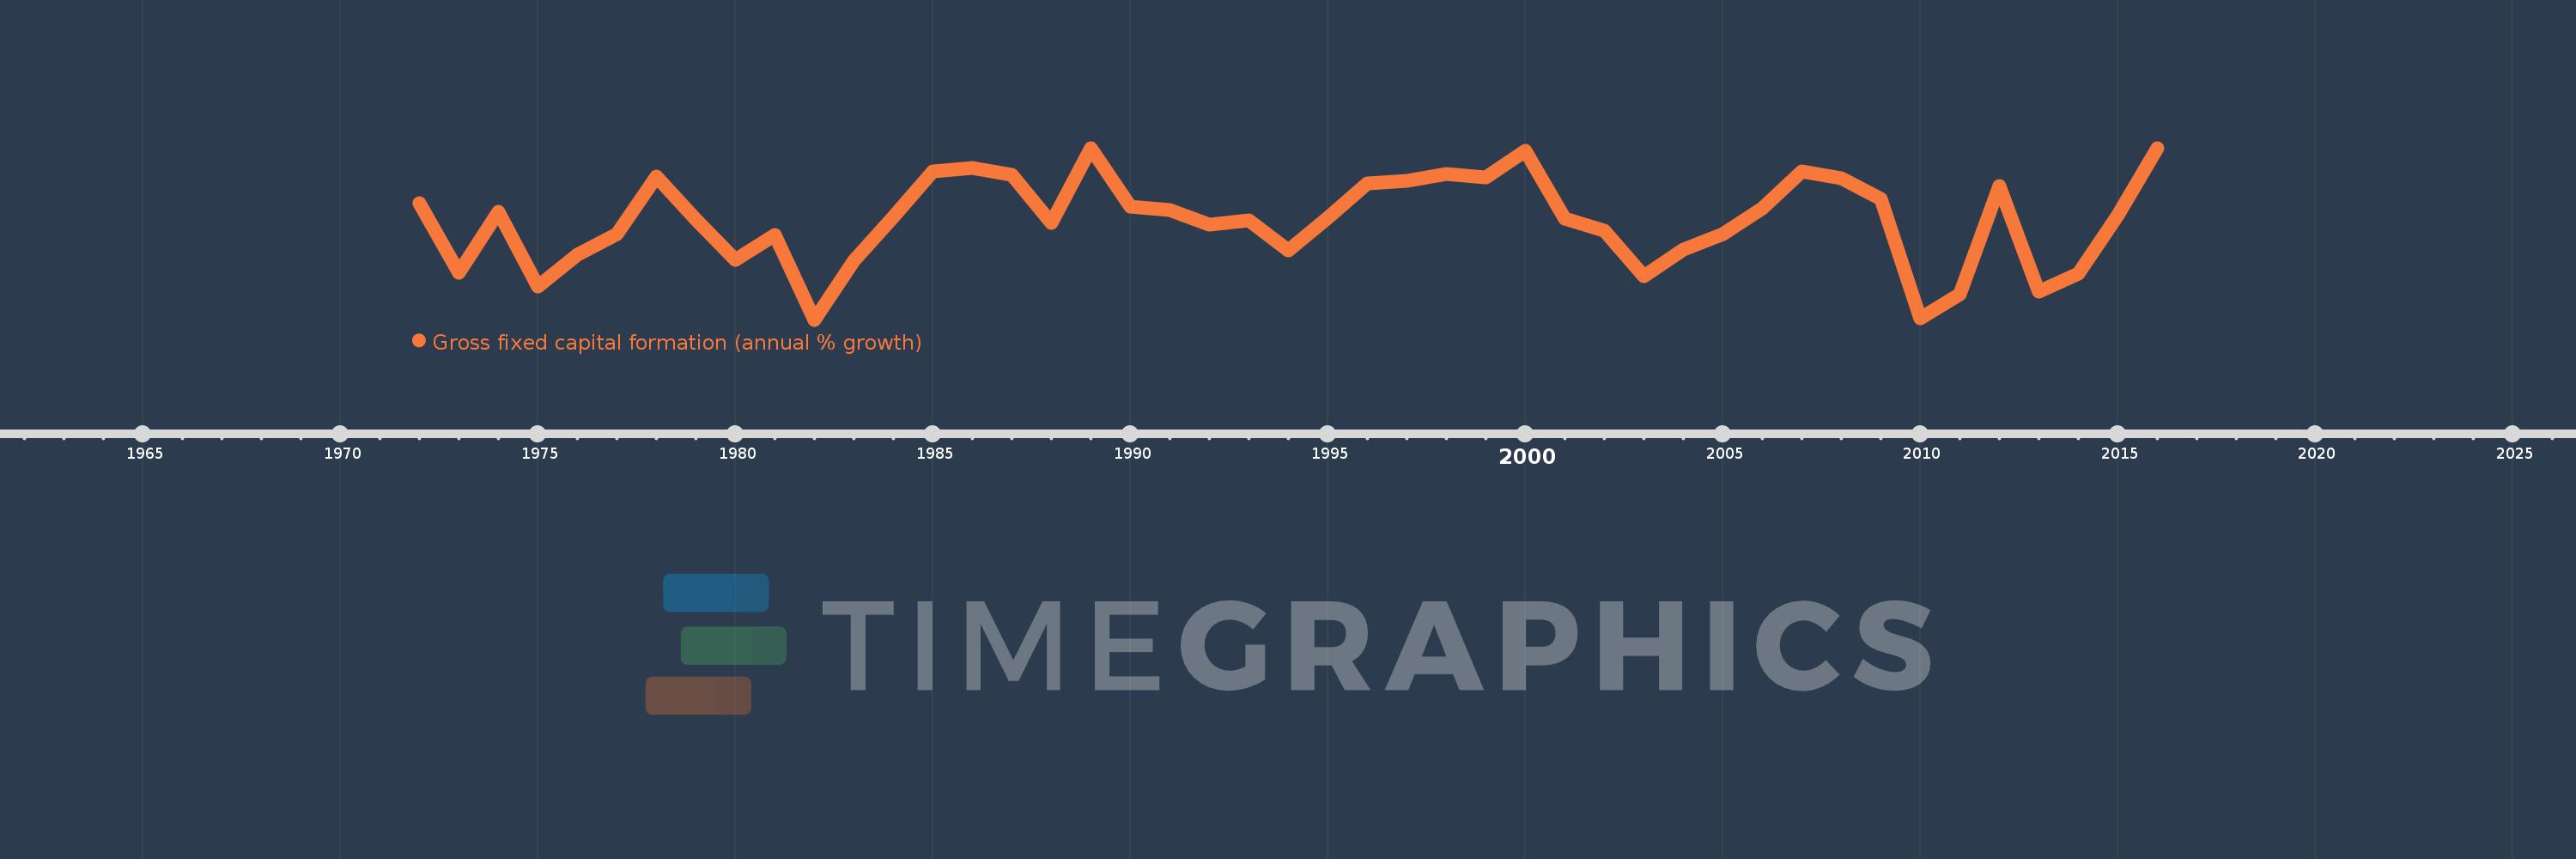
Gross fixed capital formation (annual % growth)
2016,2015,2014,2013,2012,2011,2010,2009,2008,2007,2006,2005,2004,2003,2002,2001,2000,1999,1998,1997,1996,1995,1994,1993,1992,1991,1990,1989,1988,1987,1986,1985,1984,1983,1982,1981,1980,1979,1978,1977,1976,1975,1974,1973,1972
This statistics in other country:
AlbaniaAlgeriaAntigua and BarbudaArab WorldArgentinaArmeniaAustraliaAustriaAzerbaijanBahamas, TheBahrainBangladeshBarbadosBelarusBelgiumBelizeBeninBhutanBoliviaBosnia and HerzegovinaBotswanaBrazilBrunei DarussalamBulgariaBurkina FasoBurundiCabo VerdeCambodiaCameroonCanadaCaribbean small statesCentral Europe and the BalticsChadChileChinaColombiaComorosCongo, Dem. Rep.Congo, Rep.Costa RicaCote d'IvoireCroatiaCubaCyprusCzech RepublicDenmarkDjiboutiDominican RepublicEarly-demographic dividendEast Asia & PacificEast Asia & Pacific (excluding high income)East Asia & Pacific (IDA & IBRD countries)EcuadorEgypt, Arab Rep.El SalvadorEquatorial GuineaEritreaEstoniaEthiopiaEuro areaEurope & Central AsiaEurope & Central Asia (excluding high income)Europe & Central Asia (IDA & IBRD countries)European UnionFinlandFranceGabonGambia, TheGeorgiaGermanyGhanaGreeceGuatemalaGuineaGuinea-BissauHaitiHeavily indebted poor countries (HIPC)High incomeHondurasHong Kong SAR, ChinaHungaryIBRD onlyIcelandIDA & IBRD totalIDA blendIDA onlyIDA totalIndiaIndonesiaIran, Islamic Rep.IrelandIsraelItalyJamaicaJapanJordanKazakhstanKenyaKorea, Rep.KosovoKyrgyz RepublicLao PDRLate-demographic dividendLatin America & Caribbean Latin America & Caribbean (excluding high income)Latin America & the Caribbean (IDA & IBRD countries)LatviaLeast developed countries: UN classificationLebanonLiberiaLithuaniaLow & middle incomeLow incomeLower middle incomeLuxembourgMacao SAR, ChinaMacedonia, FYRMadagascarMalawiMalaysiaMaliMaltaMauritaniaMauritiusMexicoMiddle East & North AfricaMiddle East & North Africa (excluding high income)Middle East & North Africa (IDA & IBRD countries)Middle incomeMoldovaMongoliaMontenegroMoroccoMozambiqueNamibiaNepalNetherlandsNew ZealandNicaraguaNigerNigeriaNorth AmericaNorwayOECD membersOmanPakistanPanamaPapua New GuineaParaguayPeruPhilippinesPolandPortugalPost-demographic dividendPre-demographic dividendPuerto RicoRomaniaRussian FederationRwandaSaudi ArabiaSenegalSerbiaSeychellesSierra LeoneSingaporeSlovak RepublicSloveniaSomaliaSouth AfricaSouth AsiaSouth Asia (IDA & IBRD)South SudanSpainSri LankaSub-Saharan Africa Sub-Saharan Africa (excluding high income)Sub-Saharan Africa (IDA & IBRD countries)SudanSurinameSwazilandSwedenSwitzerlandSyrian Arab RepublicTajikistanTanzaniaThailandTimor-LesteTogoTrinidad and TobagoTunisiaTurkeyUgandaUkraineUnited Arab EmiratesUnited KingdomUnited StatesUpper middle incomeUruguayUzbekistanVanuatuVenezuela, RBVietnamWest Bank and GazaWorldZimbabwe Timeline:
This timeline shows a graph from 1972 to 2016 of Netherlands. No data until 1971. Number of actual observations by date: 45.
Source name:
World Development Indicators
Source organization:
World Bank national accounts data, and OECD National Accounts data files.
Categories, topics:
Economy & Growth
Last updated:
apr 23, 2017
Indicators value changes by year
Minimum:
-9.399
jan 1, 1982
At the date of observation
Value
Absolute change
Change from previous value
jan 1, 1972
3.627
+3.627
0.0%
jan 1, 1973
-4.102
-7.729
-213.09%
jan 1, 1974
2.695
+6.796
-165.69%
jan 1, 1975
-5.635
-8.329
-309.11%
jan 1, 1976
-2.064
+3.571
-63.38%
jan 1, 1977
0.206
+2.269
-109.98%
jan 1, 1978
6.619
+6.413
3.11K%
jan 1, 1979
1.857
-4.762
-71.95%
jan 1, 1980
-2.68
-4.537
-244.38%
jan 1, 1981
0.133
+2.813
-104.96%
jan 1, 1982
-9.399
-9.532
-7.17K%
jan 1, 1983
-2.759
+6.64
-70.64%
jan 1, 1984
2.159
+4.918
-178.24%
jan 1, 1985
7.214
+5.055
234.16%
jan 1, 1986
7.617
+0.403
5.59%
jan 1, 1987
6.808
-0.809
-10.63%
jan 1, 1988
1.46
-5.348
-78.56%
jan 1, 1989
9.798
+8.338
571.23%
jan 1, 1990
3.278
-6.52
-66.54%
jan 1, 1991
2.882
-0.396
-12.08%
jan 1, 1992
1.263
-1.619
-56.16%
jan 1, 1993
1.783
+0.52
41.13%
jan 1, 1994
-1.637
-3.42
-191.8%
jan 1, 1995
2.038
+3.674
-224.49%
jan 1, 1996
5.889
+3.852
189.03%
jan 1, 1997
6.147
+0.257
4.37%
jan 1, 1998
6.933
+0.786
12.79%
jan 1, 1999
6.541
-0.392
-5.65%
jan 1, 2000
9.535
+2.994
45.78%
jan 1, 2001
1.922
-7.613
-79.84%
jan 1, 2002
0.62
-1.302
-67.73%
jan 1, 2003
-4.514
-5.134
-827.8%
jan 1, 2004
-1.563
+2.951
-65.37%
jan 1, 2005
0.158
+1.721
-110.1%
jan 1, 2006
3.104
+2.946
1.87K%
jan 1, 2007
7.211
+4.107
132.29%
jan 1, 2008
6.472
-0.739
-10.24%
jan 1, 2009
4.139
-2.333
-36.05%
jan 1, 2010
-9.215
-13.354
-322.62%
jan 1, 2011
-6.518
+2.696
-29.26%
jan 1, 2012
5.563
+12.081
-185.34%
jan 1, 2013
-6.281
-11.843
-212.9%
jan 1, 2014
-4.258
+2.022
-32.2%
jan 1, 2015
2.283
+6.541
-153.6%
jan 1, 2016
9.858
+7.575
331.88%
Ranking of countries by current statistics by years


Comments: