29
/
en
AIzaSyAYiBZKx7MnpbEhh9jyipgxe19OcubqV5w
April 1, 2024
36614
IBRD only
IBD
false
2
1
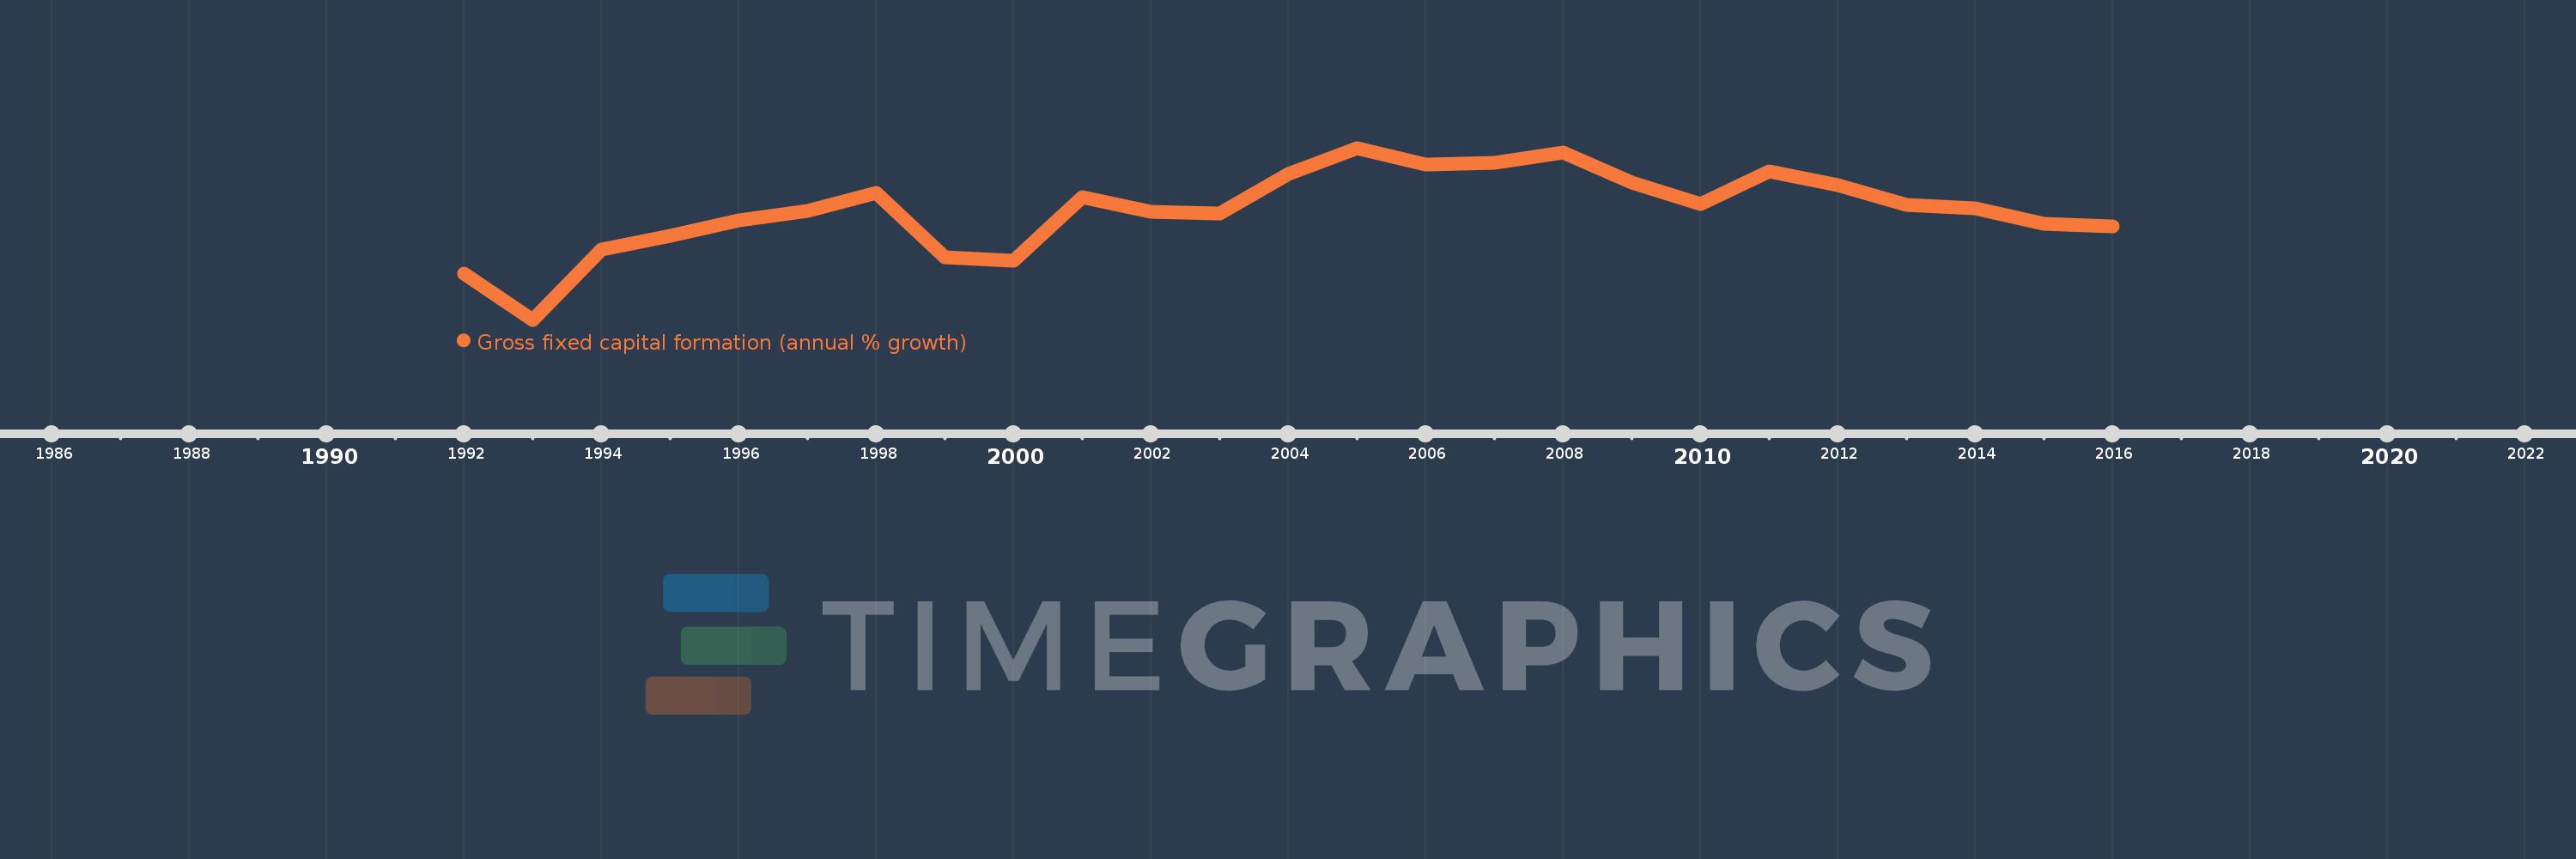
Gross fixed capital formation (annual % growth)
2016,2015,2014,2013,2012,2011,2010,2009,2008,2007,2006,2005,2004,2003,2002,2001,2000,1999,1998,1997,1996,1995,1994,1993,1992
This statistics in other country:
AlbaniaAlgeriaAntigua and BarbudaArab WorldArgentinaArmeniaAustraliaAustriaAzerbaijanBahamas, TheBahrainBangladeshBarbadosBelarusBelgiumBelizeBeninBhutanBoliviaBosnia and HerzegovinaBotswanaBrazilBrunei DarussalamBulgariaBurkina FasoBurundiCabo VerdeCambodiaCameroonCanadaCaribbean small statesCentral Europe and the BalticsChadChileChinaColombiaComorosCongo, Dem. Rep.Congo, Rep.Costa RicaCote d'IvoireCroatiaCubaCyprusCzech RepublicDenmarkDjiboutiDominican RepublicEarly-demographic dividendEast Asia & PacificEast Asia & Pacific (excluding high income)East Asia & Pacific (IDA & IBRD countries)EcuadorEgypt, Arab Rep.El SalvadorEquatorial GuineaEritreaEstoniaEthiopiaEuro areaEurope & Central AsiaEurope & Central Asia (excluding high income)Europe & Central Asia (IDA & IBRD countries)European UnionFinlandFranceGabonGambia, TheGeorgiaGermanyGhanaGreeceGuatemalaGuineaGuinea-BissauHaitiHeavily indebted poor countries (HIPC)High incomeHondurasHong Kong SAR, ChinaHungaryIBRD onlyIcelandIDA & IBRD totalIDA blendIDA onlyIDA totalIndiaIndonesiaIran, Islamic Rep.IrelandIsraelItalyJamaicaJapanJordanKazakhstanKenyaKorea, Rep.KosovoKyrgyz RepublicLao PDRLate-demographic dividendLatin America & Caribbean Latin America & Caribbean (excluding high income)Latin America & the Caribbean (IDA & IBRD countries)LatviaLeast developed countries: UN classificationLebanonLiberiaLithuaniaLow & middle incomeLow incomeLower middle incomeLuxembourgMacao SAR, ChinaMacedonia, FYRMadagascarMalawiMalaysiaMaliMaltaMauritaniaMauritiusMexicoMiddle East & North AfricaMiddle East & North Africa (excluding high income)Middle East & North Africa (IDA & IBRD countries)Middle incomeMoldovaMongoliaMontenegroMoroccoMozambiqueNamibiaNepalNetherlandsNew ZealandNicaraguaNigerNigeriaNorth AmericaNorwayOECD membersOmanPakistanPanamaPapua New GuineaParaguayPeruPhilippinesPolandPortugalPost-demographic dividendPre-demographic dividendPuerto RicoRomaniaRussian FederationRwandaSaudi ArabiaSenegalSerbiaSeychellesSierra LeoneSingaporeSlovak RepublicSloveniaSomaliaSouth AfricaSouth AsiaSouth Asia (IDA & IBRD)South SudanSpainSri LankaSub-Saharan Africa Sub-Saharan Africa (excluding high income)Sub-Saharan Africa (IDA & IBRD countries)SudanSurinameSwazilandSwedenSwitzerlandSyrian Arab RepublicTajikistanTanzaniaThailandTimor-LesteTogoTrinidad and TobagoTunisiaTurkeyUgandaUkraineUnited Arab EmiratesUnited KingdomUnited StatesUpper middle incomeUruguayUzbekistanVanuatuVenezuela, RBVietnamWest Bank and GazaWorldZimbabwe Timeline:
This timeline shows a graph from 1992 to 2016 of IBRD only. No data until 1991. Number of actual observations by date: 25.
Source name:
World Development Indicators
Source organization:
World Bank national accounts data, and OECD National Accounts data files.
Categories, topics:
Economy & Growth
Last updated:
apr 23, 2017
Indicators value changes by year
Minimum:
-8.387
jan 1, 1993
Maximum:
13.571
jan 1, 2005
At the date of observation
Value
Absolute change
Change from previous value
jan 1, 1992
-2.506
-2.506
0.0%
jan 1, 1993
-8.387
-5.881
234.65%
jan 1, 1994
0.61
+8.997
-107.27%
jan 1, 1995
2.36
+1.751
287.17%
jan 1, 1996
4.314
+1.954
82.81%
jan 1, 1997
5.481
+1.167
27.05%
jan 1, 1998
7.873
+2.391
43.63%
jan 1, 1999
-0.392
-8.265
-104.98%
jan 1, 2000
-0.827
-0.435
110.81%
jan 1, 2001
7.315
+8.141
-984.89%
jan 1, 2002
5.4
-1.915
-26.18%
jan 1, 2003
5.188
-0.212
-3.92%
jan 1, 2004
10.19
+5.002
96.41%
jan 1, 2005
13.571
+3.381
33.18%
jan 1, 2006
11.446
-2.125
-15.65%
jan 1, 2007
11.643
+0.197
1.72%
jan 1, 2008
12.967
+1.323
11.36%
jan 1, 2009
9.173
-3.793
-29.26%
jan 1, 2010
6.357
-2.816
-30.7%
jan 1, 2011
10.614
+4.257
66.97%
jan 1, 2012
8.776
-1.838
-17.32%
jan 1, 2013
6.25
-2.526
-28.78%
jan 1, 2014
5.8
-0.451
-7.21%
jan 1, 2015
3.85
-1.95
-33.62%
jan 1, 2016
3.556
-0.294
-7.64%
Ranking of countries by current statistics by years


Comments: