29
/
en
AIzaSyAYiBZKx7MnpbEhh9jyipgxe19OcubqV5w
April 1, 2024
31630
Europe & Central Asia (excluding high income)
ECA
false
2
1
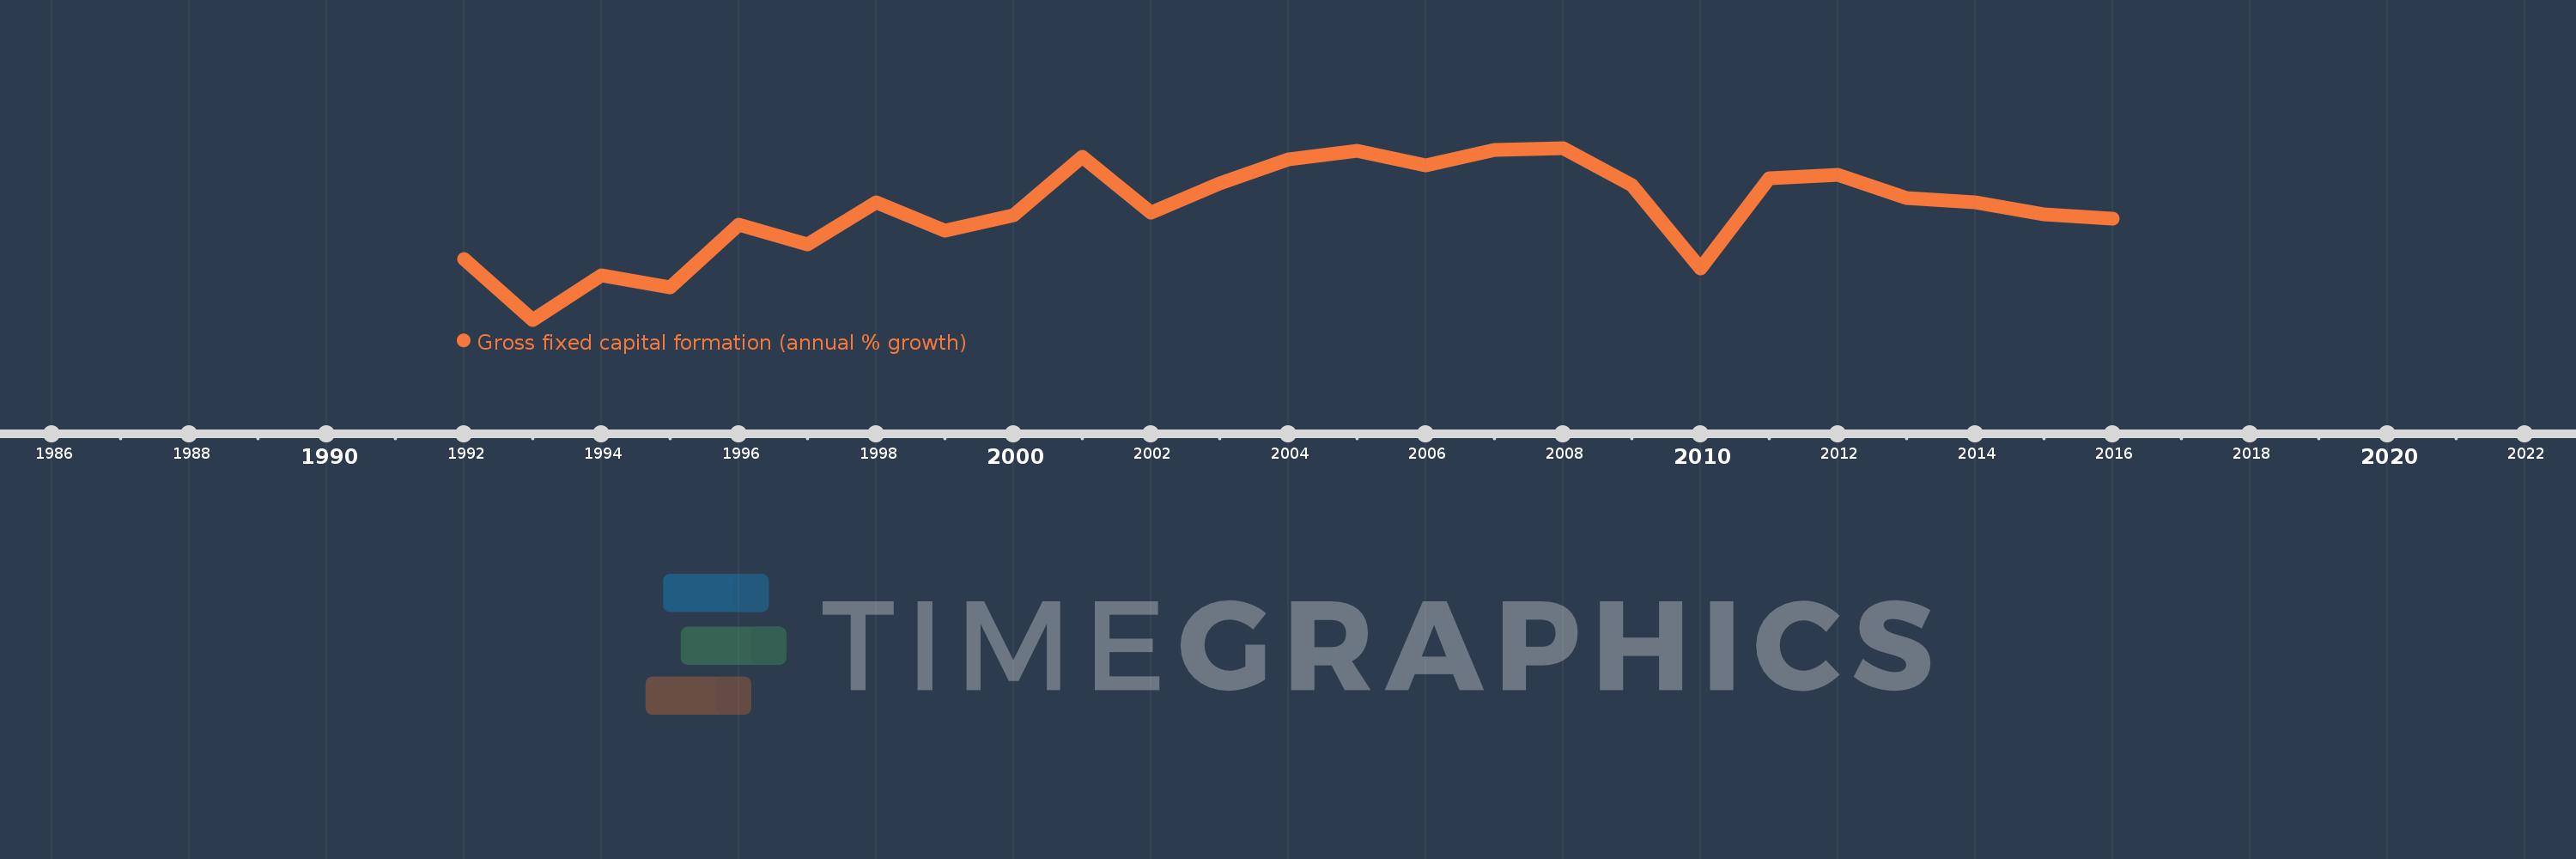
Gross fixed capital formation (annual % growth)
2016,2015,2014,2013,2012,2011,2010,2009,2008,2007,2006,2005,2004,2003,2002,2001,2000,1999,1998,1997,1996,1995,1994,1993,1992
This statistics in other country:
AlbaniaAlgeriaAntigua and BarbudaArab WorldArgentinaArmeniaAustraliaAustriaAzerbaijanBahamas, TheBahrainBangladeshBarbadosBelarusBelgiumBelizeBeninBhutanBoliviaBosnia and HerzegovinaBotswanaBrazilBrunei DarussalamBulgariaBurkina FasoBurundiCabo VerdeCambodiaCameroonCanadaCaribbean small statesCentral Europe and the BalticsChadChileChinaColombiaComorosCongo, Dem. Rep.Congo, Rep.Costa RicaCote d'IvoireCroatiaCubaCyprusCzech RepublicDenmarkDjiboutiDominican RepublicEarly-demographic dividendEast Asia & PacificEast Asia & Pacific (excluding high income)East Asia & Pacific (IDA & IBRD countries)EcuadorEgypt, Arab Rep.El SalvadorEquatorial GuineaEritreaEstoniaEthiopiaEuro areaEurope & Central AsiaEurope & Central Asia (excluding high income)Europe & Central Asia (IDA & IBRD countries)European UnionFinlandFranceGabonGambia, TheGeorgiaGermanyGhanaGreeceGuatemalaGuineaGuinea-BissauHaitiHeavily indebted poor countries (HIPC)High incomeHondurasHong Kong SAR, ChinaHungaryIBRD onlyIcelandIDA & IBRD totalIDA blendIDA onlyIDA totalIndiaIndonesiaIran, Islamic Rep.IrelandIsraelItalyJamaicaJapanJordanKazakhstanKenyaKorea, Rep.KosovoKyrgyz RepublicLao PDRLate-demographic dividendLatin America & Caribbean Latin America & Caribbean (excluding high income)Latin America & the Caribbean (IDA & IBRD countries)LatviaLeast developed countries: UN classificationLebanonLiberiaLithuaniaLow & middle incomeLow incomeLower middle incomeLuxembourgMacao SAR, ChinaMacedonia, FYRMadagascarMalawiMalaysiaMaliMaltaMauritaniaMauritiusMexicoMiddle East & North AfricaMiddle East & North Africa (excluding high income)Middle East & North Africa (IDA & IBRD countries)Middle incomeMoldovaMongoliaMontenegroMoroccoMozambiqueNamibiaNepalNetherlandsNew ZealandNicaraguaNigerNigeriaNorth AmericaNorwayOECD membersOmanPakistanPanamaPapua New GuineaParaguayPeruPhilippinesPolandPortugalPost-demographic dividendPre-demographic dividendPuerto RicoRomaniaRussian FederationRwandaSaudi ArabiaSenegalSerbiaSeychellesSierra LeoneSingaporeSlovak RepublicSloveniaSomaliaSouth AfricaSouth AsiaSouth Asia (IDA & IBRD)South SudanSpainSri LankaSub-Saharan Africa Sub-Saharan Africa (excluding high income)Sub-Saharan Africa (IDA & IBRD countries)SudanSurinameSwazilandSwedenSwitzerlandSyrian Arab RepublicTajikistanTanzaniaThailandTimor-LesteTogoTrinidad and TobagoTunisiaTurkeyUgandaUkraineUnited Arab EmiratesUnited KingdomUnited StatesUpper middle incomeUruguayUzbekistanVanuatuVenezuela, RBVietnamWest Bank and GazaWorldZimbabwe Timeline:
This timeline shows a graph from 1992 to 2016 of Europe & Central Asia (excluding high income). No data until 1991. Number of actual observations by date: 25.
Source name:
World Development Indicators
Source organization:
World Bank national accounts data, and OECD National Accounts data files.
Categories, topics:
Economy & Growth
Last updated:
apr 23, 2017
Indicators value changes by year
Minimum:
-33.416
jan 1, 1993
Maximum:
17.957
jan 1, 2008
At the date of observation
Value
Absolute change
Change from previous value
jan 1, 1992
-15.367
-15.367
0.0%
jan 1, 1993
-33.416
-18.049
117.45%
jan 1, 1994
-20.066
+13.35
-39.95%
jan 1, 1995
-23.834
-3.768
18.78%
jan 1, 1996
-5.084
+18.75
-78.67%
jan 1, 1997
-10.966
-5.882
115.7%
jan 1, 1998
1.802
+12.768
-116.43%
jan 1, 1999
-6.821
-8.623
-478.5%
jan 1, 2000
-2.232
+4.589
-67.28%
jan 1, 2001
15.276
+17.508
-784.39%
jan 1, 2002
-1.286
-16.562
-108.42%
jan 1, 2003
7.331
+8.617
-670.15%
jan 1, 2004
14.594
+7.263
99.07%
jan 1, 2005
17.168
+2.574
17.63%
jan 1, 2006
12.713
-4.455
-25.95%
jan 1, 2007
17.364
+4.651
36.58%
jan 1, 2008
17.957
+0.594
3.42%
jan 1, 2009
6.929
-11.028
-61.41%
jan 1, 2010
-18.06
-24.99
-360.64%
jan 1, 2011
8.94
+27.0
-149.5%
jan 1, 2012
9.95
+1.01
11.3%
jan 1, 2013
3.099
-6.851
-68.86%
jan 1, 2014
1.695
-1.403
-45.29%
jan 1, 2015
-1.908
-3.603
-212.53%
jan 1, 2016
-3.143
-1.235
64.74%
Ranking of countries by current statistics by years


Comments: