29
/
en
AIzaSyAYiBZKx7MnpbEhh9jyipgxe19OcubqV5w
April 1, 2024
42427
Latin America & Caribbean (excluding high income)
LAC
false
2
1
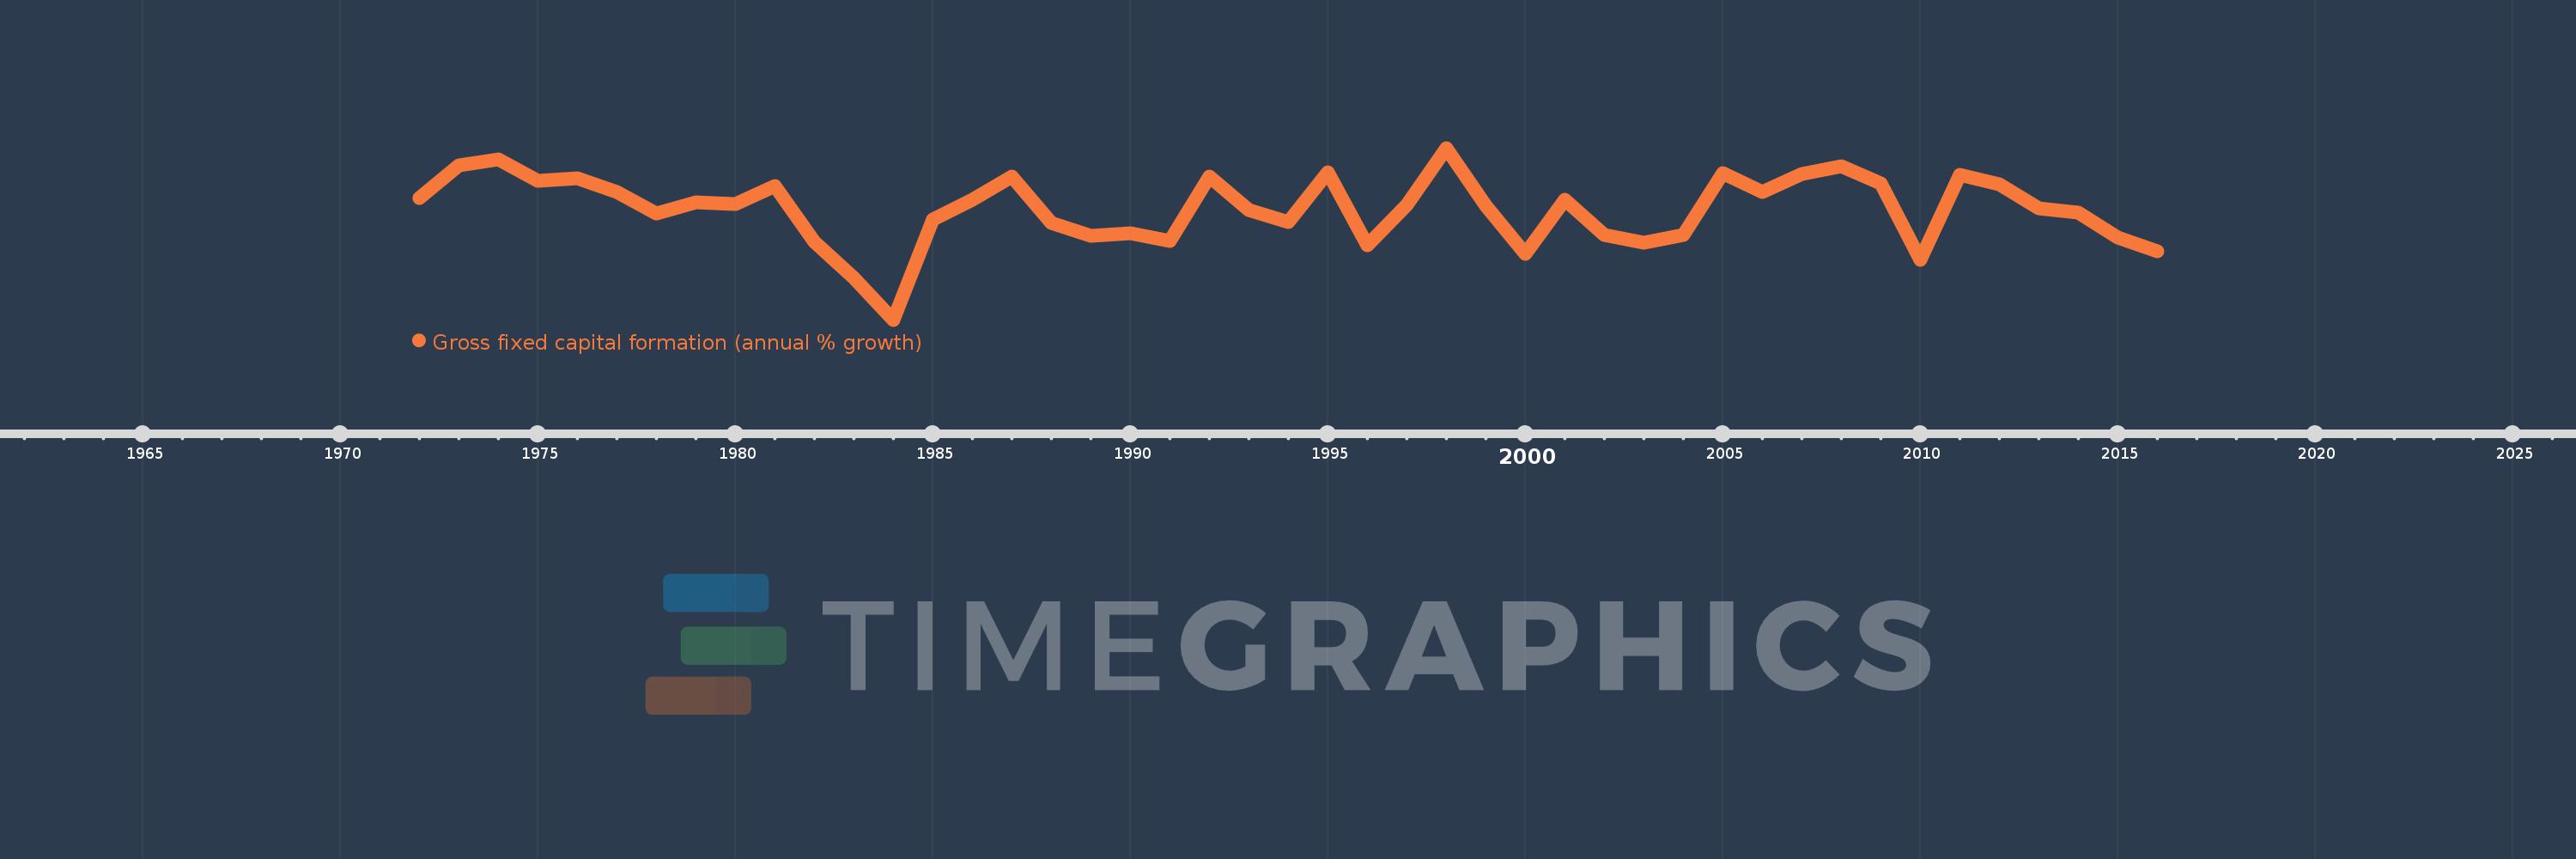
Gross fixed capital formation (annual % growth)
2016,2015,2014,2013,2012,2011,2010,2009,2008,2007,2006,2005,2004,2003,2002,2001,2000,1999,1998,1997,1996,1995,1994,1993,1992,1991,1990,1989,1988,1987,1986,1985,1984,1983,1982,1981,1980,1979,1978,1977,1976,1975,1974,1973,1972
This statistics in other country:
AlbaniaAlgeriaAntigua and BarbudaArab WorldArgentinaArmeniaAustraliaAustriaAzerbaijanBahamas, TheBahrainBangladeshBarbadosBelarusBelgiumBelizeBeninBhutanBoliviaBosnia and HerzegovinaBotswanaBrazilBrunei DarussalamBulgariaBurkina FasoBurundiCabo VerdeCambodiaCameroonCanadaCaribbean small statesCentral Europe and the BalticsChadChileChinaColombiaComorosCongo, Dem. Rep.Congo, Rep.Costa RicaCote d'IvoireCroatiaCubaCyprusCzech RepublicDenmarkDjiboutiDominican RepublicEarly-demographic dividendEast Asia & PacificEast Asia & Pacific (excluding high income)East Asia & Pacific (IDA & IBRD countries)EcuadorEgypt, Arab Rep.El SalvadorEquatorial GuineaEritreaEstoniaEthiopiaEuro areaEurope & Central AsiaEurope & Central Asia (excluding high income)Europe & Central Asia (IDA & IBRD countries)European UnionFinlandFranceGabonGambia, TheGeorgiaGermanyGhanaGreeceGuatemalaGuineaGuinea-BissauHaitiHeavily indebted poor countries (HIPC)High incomeHondurasHong Kong SAR, ChinaHungaryIBRD onlyIcelandIDA & IBRD totalIDA blendIDA onlyIDA totalIndiaIndonesiaIran, Islamic Rep.IrelandIsraelItalyJamaicaJapanJordanKazakhstanKenyaKorea, Rep.KosovoKyrgyz RepublicLao PDRLate-demographic dividendLatin America & Caribbean Latin America & Caribbean (excluding high income)Latin America & the Caribbean (IDA & IBRD countries)LatviaLeast developed countries: UN classificationLebanonLiberiaLithuaniaLow & middle incomeLow incomeLower middle incomeLuxembourgMacao SAR, ChinaMacedonia, FYRMadagascarMalawiMalaysiaMaliMaltaMauritaniaMauritiusMexicoMiddle East & North AfricaMiddle East & North Africa (excluding high income)Middle East & North Africa (IDA & IBRD countries)Middle incomeMoldovaMongoliaMontenegroMoroccoMozambiqueNamibiaNepalNetherlandsNew ZealandNicaraguaNigerNigeriaNorth AmericaNorwayOECD membersOmanPakistanPanamaPapua New GuineaParaguayPeruPhilippinesPolandPortugalPost-demographic dividendPre-demographic dividendPuerto RicoRomaniaRussian FederationRwandaSaudi ArabiaSenegalSerbiaSeychellesSierra LeoneSingaporeSlovak RepublicSloveniaSomaliaSouth AfricaSouth AsiaSouth Asia (IDA & IBRD)South SudanSpainSri LankaSub-Saharan Africa Sub-Saharan Africa (excluding high income)Sub-Saharan Africa (IDA & IBRD countries)SudanSurinameSwazilandSwedenSwitzerlandSyrian Arab RepublicTajikistanTanzaniaThailandTimor-LesteTogoTrinidad and TobagoTunisiaTurkeyUgandaUkraineUnited Arab EmiratesUnited KingdomUnited StatesUpper middle incomeUruguayUzbekistanVanuatuVenezuela, RBVietnamWest Bank and GazaWorldZimbabwe Timeline:
This timeline shows a graph from 1972 to 2016 of Latin America & Caribbean (excluding high income). No data until 1971. Number of actual observations by date: 45.
Source name:
World Development Indicators
Source organization:
World Bank national accounts data, and OECD National Accounts data files.
Categories, topics:
Economy & Growth
Last updated:
apr 23, 2017
Indicators value changes by year
Minimum:
-18.907
jan 1, 1984
At the date of observation
Value
Absolute change
Change from previous value
jan 1, 1972
6.025
+6.025
0.0%
jan 1, 1973
12.565
+6.541
108.56%
jan 1, 1974
13.837
+1.272
10.12%
jan 1, 1975
9.392
-4.446
-32.13%
jan 1, 1976
9.999
+0.608
6.47%
jan 1, 1977
7.185
-2.814
-28.14%
jan 1, 1978
2.839
-4.346
-60.49%
jan 1, 1979
5.075
+2.237
78.78%
jan 1, 1980
4.69
-0.386
-7.6%
jan 1, 1981
8.354
+3.664
78.13%
jan 1, 1982
-3.002
-11.356
-135.94%
jan 1, 1983
-10.447
-7.445
247.97%
jan 1, 1984
-18.907
-8.46
80.98%
jan 1, 1985
1.63
+20.537
-108.62%
jan 1, 1986
5.667
+4.038
247.78%
jan 1, 1987
10.306
+4.639
81.85%
jan 1, 1988
0.831
-9.476
-91.94%
jan 1, 1989
-1.675
-2.506
-301.69%
jan 1, 1990
-1.18
+0.495
-29.53%
jan 1, 1991
-2.808
-1.628
137.9%
jan 1, 1992
10.356
+13.164
-468.76%
jan 1, 1993
3.527
-6.829
-65.94%
jan 1, 1994
0.979
-2.548
-72.24%
jan 1, 1995
11.167
+10.188
1.04K%
jan 1, 1996
-3.622
-14.789
-132.43%
jan 1, 1997
4.543
+8.165
-225.42%
jan 1, 1998
16.19
+11.647
256.38%
jan 1, 1999
4.296
-11.893
-73.46%
jan 1, 2000
-5.442
-9.738
-226.66%
jan 1, 2001
5.65
+11.092
-203.83%
jan 1, 2002
-1.621
-7.271
-128.69%
jan 1, 2003
-3.153
-1.532
94.49%
jan 1, 2004
-1.507
+1.646
-52.19%
jan 1, 2005
10.987
+12.494
-828.82%
jan 1, 2006
7.228
-3.759
-34.21%
jan 1, 2007
10.943
+3.715
51.4%
jan 1, 2008
12.497
+1.554
14.2%
jan 1, 2009
9.025
-3.471
-27.78%
jan 1, 2010
-6.693
-15.718
-174.16%
jan 1, 2011
10.649
+17.342
-259.11%
jan 1, 2012
8.802
-1.847
-17.35%
jan 1, 2013
3.841
-4.961
-56.36%
jan 1, 2014
2.996
-0.845
-22.0%
jan 1, 2015
-2.057
-5.053
-168.65%
jan 1, 2016
-4.904
-2.847
138.42%
Ranking of countries by current statistics by years


Comments: