29
/
en
AIzaSyAYiBZKx7MnpbEhh9jyipgxe19OcubqV5w
April 1, 2024
66060
Algeria
DZA
true
2
1
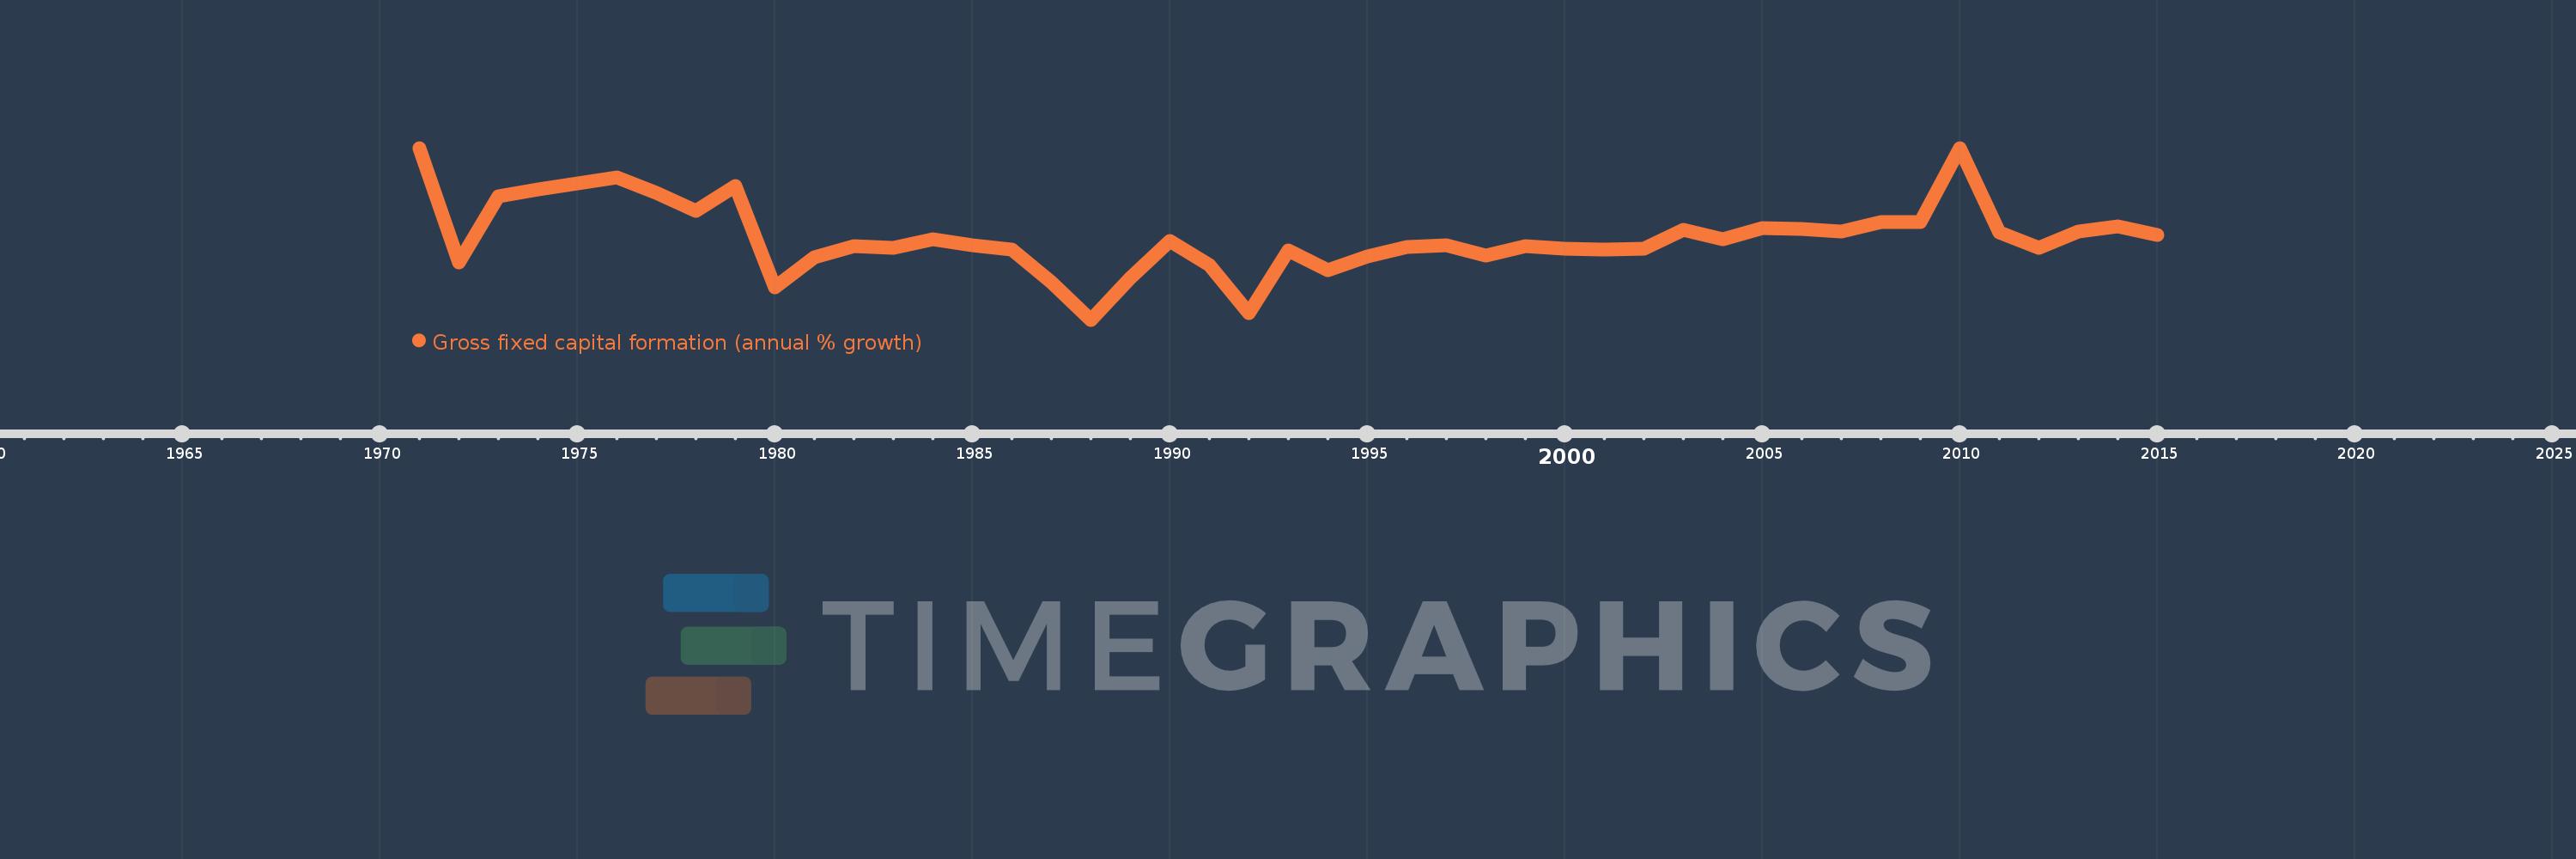
Gross fixed capital formation (annual % growth)
2015,2014,2013,2012,2011,2010,2009,2008,2007,2006,2005,2004,2003,2002,2001,2000,1999,1998,1997,1996,1995,1994,1993,1992,1991,1990,1989,1988,1987,1986,1985,1984,1983,1982,1981,1980,1979,1978,1977,1976,1975,1974,1973,1972,1971
This statistics in other country:
AlbaniaAlgeriaAntigua and BarbudaArab WorldArgentinaArmeniaAustraliaAustriaAzerbaijanBahamas, TheBahrainBangladeshBarbadosBelarusBelgiumBelizeBeninBhutanBoliviaBosnia and HerzegovinaBotswanaBrazilBrunei DarussalamBulgariaBurkina FasoBurundiCabo VerdeCambodiaCameroonCanadaCaribbean small statesCentral Europe and the BalticsChadChileChinaColombiaComorosCongo, Dem. Rep.Congo, Rep.Costa RicaCote d'IvoireCroatiaCubaCyprusCzech RepublicDenmarkDjiboutiDominican RepublicEarly-demographic dividendEast Asia & PacificEast Asia & Pacific (excluding high income)East Asia & Pacific (IDA & IBRD countries)EcuadorEgypt, Arab Rep.El SalvadorEquatorial GuineaEritreaEstoniaEthiopiaEuro areaEurope & Central AsiaEurope & Central Asia (excluding high income)Europe & Central Asia (IDA & IBRD countries)European UnionFinlandFranceGabonGambia, TheGeorgiaGermanyGhanaGreeceGuatemalaGuineaGuinea-BissauHaitiHeavily indebted poor countries (HIPC)High incomeHondurasHong Kong SAR, ChinaHungaryIBRD onlyIcelandIDA & IBRD totalIDA blendIDA onlyIDA totalIndiaIndonesiaIran, Islamic Rep.IrelandIsraelItalyJamaicaJapanJordanKazakhstanKenyaKorea, Rep.KosovoKyrgyz RepublicLao PDRLate-demographic dividendLatin America & Caribbean Latin America & Caribbean (excluding high income)Latin America & the Caribbean (IDA & IBRD countries)LatviaLeast developed countries: UN classificationLebanonLiberiaLithuaniaLow & middle incomeLow incomeLower middle incomeLuxembourgMacao SAR, ChinaMacedonia, FYRMadagascarMalawiMalaysiaMaliMaltaMauritaniaMauritiusMexicoMiddle East & North AfricaMiddle East & North Africa (excluding high income)Middle East & North Africa (IDA & IBRD countries)Middle incomeMoldovaMongoliaMontenegroMoroccoMozambiqueNamibiaNepalNetherlandsNew ZealandNicaraguaNigerNigeriaNorth AmericaNorwayOECD membersOmanPakistanPanamaPapua New GuineaParaguayPeruPhilippinesPolandPortugalPost-demographic dividendPre-demographic dividendPuerto RicoRomaniaRussian FederationRwandaSaudi ArabiaSenegalSerbiaSeychellesSierra LeoneSingaporeSlovak RepublicSloveniaSomaliaSouth AfricaSouth AsiaSouth Asia (IDA & IBRD)South SudanSpainSri LankaSub-Saharan Africa Sub-Saharan Africa (excluding high income)Sub-Saharan Africa (IDA & IBRD countries)SudanSurinameSwazilandSwedenSwitzerlandSyrian Arab RepublicTajikistanTanzaniaThailandTimor-LesteTogoTrinidad and TobagoTunisiaTurkeyUgandaUkraineUnited Arab EmiratesUnited KingdomUnited StatesUpper middle incomeUruguayUzbekistanVanuatuVenezuela, RBVietnamWest Bank and GazaWorldZimbabwe Timeline:
This timeline shows a graph from 1971 to 2015 of Algeria. No data until 1970. Number of actual observations by date: 45.
Source name:
World Development Indicators
Source organization:
World Bank national accounts data, and OECD National Accounts data files.
Categories, topics:
Economy & Growth
Last updated:
apr 23, 2017
Indicators value changes by year
Maximum:
29.675
jan 1, 2010
At the date of observation
Value
Absolute change
Change from previous value
jan 1, 1971
29.655
+29.655
0.0%
jan 1, 1972
-1.064
-30.719
-103.59%
jan 1, 1973
16.667
+17.731
-1.67K%
jan 1, 1974
18.433
+1.767
10.6%
jan 1, 1975
20.233
+1.8
9.77%
jan 1, 1976
21.683
+1.449
7.16%
jan 1, 1977
17.553
-4.13
-19.05%
jan 1, 1978
12.67
-4.884
-27.82%
jan 1, 1979
19.478
+6.808
53.74%
jan 1, 1980
-7.899
-27.377
-140.55%
jan 1, 1981
0.182
+8.082
-102.31%
jan 1, 1982
3.2
+3.018
1.65K%
jan 1, 1983
2.8
-0.4
-12.5%
jan 1, 1984
5.1
+2.3
82.14%
jan 1, 1985
3.6
-1.5
-29.41%
jan 1, 1986
2.3
-1.3
-36.11%
jan 1, 1987
-6.3
-8.6
-373.91%
jan 1, 1988
-16.5
-10.2
161.9%
jan 1, 1989
-5.2
+11.3
-68.48%
jan 1, 1990
4.7
+9.9
-190.38%
jan 1, 1991
-1.7
-6.4
-136.17%
jan 1, 1992
-14.7
-13.0
764.7%
jan 1, 1993
2.1
+16.8
-114.29%
jan 1, 1994
-3.2
-5.3
-252.38%
jan 1, 1995
0.5
+3.7
-115.63%
jan 1, 1996
3.0
+2.5
500.0%
jan 1, 1997
3.5
+0.5
16.67%
jan 1, 1998
0.8
-2.7
-77.14%
jan 1, 1999
3.3
+2.5
312.5%
jan 1, 2000
2.7
-0.6
-18.18%
jan 1, 2001
2.4
-0.3
-11.11%
jan 1, 2002
2.5
+0.1
4.17%
jan 1, 2003
7.6
+5.1
204.0%
jan 1, 2004
5.1
-2.5
-32.89%
jan 1, 2005
8.1
+3.0
58.82%
jan 1, 2006
7.9
-0.2
-2.47%
jan 1, 2007
7.2
-0.7
-8.86%
jan 1, 2008
9.8
+2.6
36.11%
jan 1, 2010
29.675
+19.875
202.81%
jan 1, 2011
7.0
-22.675
-76.41%
jan 1, 2012
2.9
-4.1
-58.57%
jan 1, 2013
7.2
+4.3
148.28%
jan 1, 2014
8.6
+1.4
19.44%
jan 1, 2015
6.4
-2.2
-25.58%
Ranking of countries by current statistics by years


Comments: