29
/
en
AIzaSyAYiBZKx7MnpbEhh9jyipgxe19OcubqV5w
April 1, 2024
167553
Kenya
KEN
true
2
1
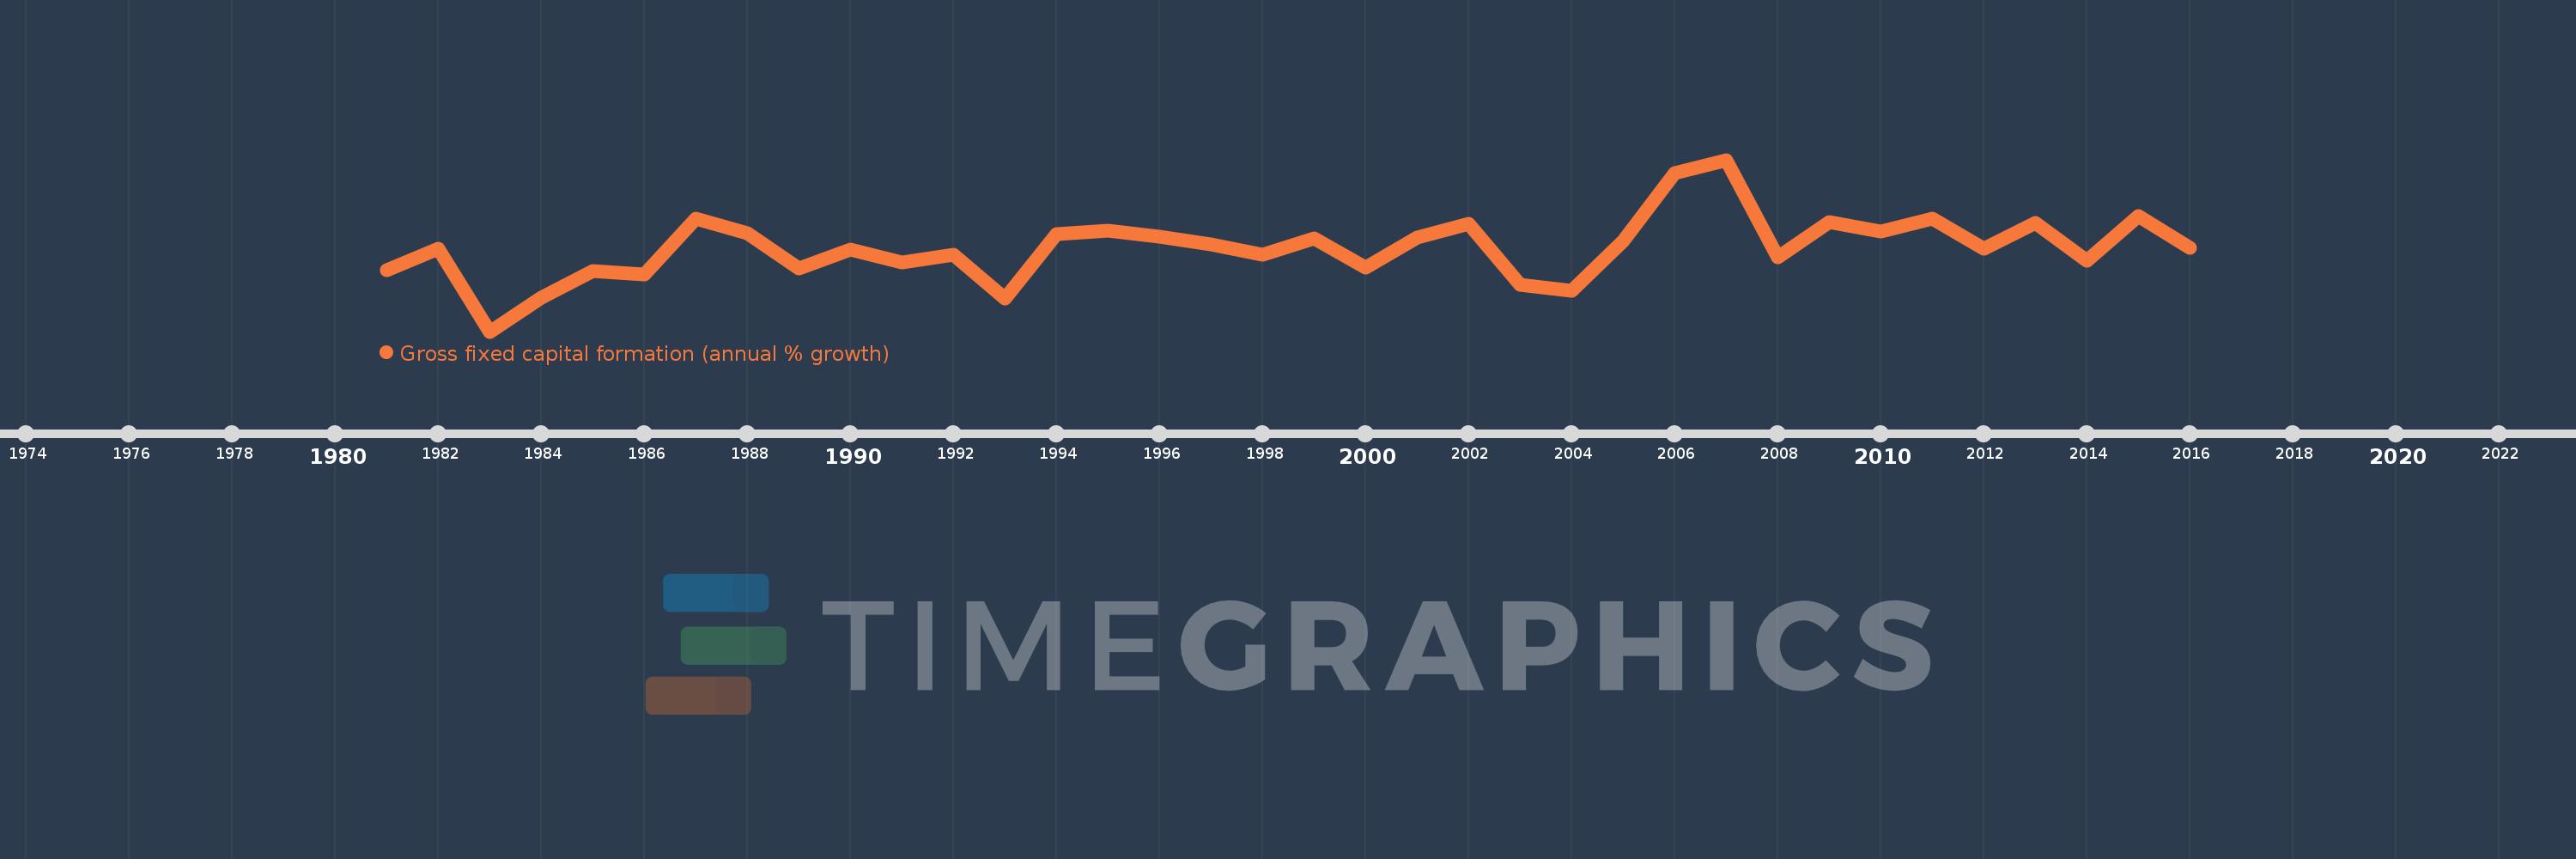
Gross fixed capital formation (annual % growth)
2016,2015,2014,2013,2012,2011,2010,2009,2008,2007,2006,2005,2004,2003,2002,2001,2000,1999,1998,1997,1996,1995,1994,1993,1992,1991,1990,1989,1988,1987,1986,1985,1984,1983,1982,1981
This statistics in other country:
AlbaniaAlgeriaAntigua and BarbudaArab WorldArgentinaArmeniaAustraliaAustriaAzerbaijanBahamas, TheBahrainBangladeshBarbadosBelarusBelgiumBelizeBeninBhutanBoliviaBosnia and HerzegovinaBotswanaBrazilBrunei DarussalamBulgariaBurkina FasoBurundiCabo VerdeCambodiaCameroonCanadaCaribbean small statesCentral Europe and the BalticsChadChileChinaColombiaComorosCongo, Dem. Rep.Congo, Rep.Costa RicaCote d'IvoireCroatiaCubaCyprusCzech RepublicDenmarkDjiboutiDominican RepublicEarly-demographic dividendEast Asia & PacificEast Asia & Pacific (excluding high income)East Asia & Pacific (IDA & IBRD countries)EcuadorEgypt, Arab Rep.El SalvadorEquatorial GuineaEritreaEstoniaEthiopiaEuro areaEurope & Central AsiaEurope & Central Asia (excluding high income)Europe & Central Asia (IDA & IBRD countries)European UnionFinlandFranceGabonGambia, TheGeorgiaGermanyGhanaGreeceGuatemalaGuineaGuinea-BissauHaitiHeavily indebted poor countries (HIPC)High incomeHondurasHong Kong SAR, ChinaHungaryIBRD onlyIcelandIDA & IBRD totalIDA blendIDA onlyIDA totalIndiaIndonesiaIran, Islamic Rep.IrelandIsraelItalyJamaicaJapanJordanKazakhstanKenyaKorea, Rep.KosovoKyrgyz RepublicLao PDRLate-demographic dividendLatin America & Caribbean Latin America & Caribbean (excluding high income)Latin America & the Caribbean (IDA & IBRD countries)LatviaLeast developed countries: UN classificationLebanonLiberiaLithuaniaLow & middle incomeLow incomeLower middle incomeLuxembourgMacao SAR, ChinaMacedonia, FYRMadagascarMalawiMalaysiaMaliMaltaMauritaniaMauritiusMexicoMiddle East & North AfricaMiddle East & North Africa (excluding high income)Middle East & North Africa (IDA & IBRD countries)Middle incomeMoldovaMongoliaMontenegroMoroccoMozambiqueNamibiaNepalNetherlandsNew ZealandNicaraguaNigerNigeriaNorth AmericaNorwayOECD membersOmanPakistanPanamaPapua New GuineaParaguayPeruPhilippinesPolandPortugalPost-demographic dividendPre-demographic dividendPuerto RicoRomaniaRussian FederationRwandaSaudi ArabiaSenegalSerbiaSeychellesSierra LeoneSingaporeSlovak RepublicSloveniaSomaliaSouth AfricaSouth AsiaSouth Asia (IDA & IBRD)South SudanSpainSri LankaSub-Saharan Africa Sub-Saharan Africa (excluding high income)Sub-Saharan Africa (IDA & IBRD countries)SudanSurinameSwazilandSwedenSwitzerlandSyrian Arab RepublicTajikistanTanzaniaThailandTimor-LesteTogoTrinidad and TobagoTunisiaTurkeyUgandaUkraineUnited Arab EmiratesUnited KingdomUnited StatesUpper middle incomeUruguayUzbekistanVanuatuVenezuela, RBVietnamWest Bank and GazaWorldZimbabwe Timeline:
This timeline shows a graph from 1981 to 2016 of Kenya. No data until 1980. Number of actual observations by date: 36.
Source name:
World Development Indicators
Source organization:
World Bank national accounts data, and OECD National Accounts data files.
Categories, topics:
Economy & Growth
Last updated:
apr 23, 2017
Indicators value changes by year
Minimum:
-20.174
jan 1, 1983
Maximum:
31.747
jan 1, 2007
At the date of observation
Value
Absolute change
Change from previous value
jan 1, 1981
-1.492
-1.492
0.0%
jan 1, 1982
4.863
+6.355
-425.99%
jan 1, 1983
-20.174
-25.037
-514.81%
jan 1, 1984
-9.917
+10.256
-50.84%
jan 1, 1985
-1.857
+8.061
-81.28%
jan 1, 1986
-2.896
-1.04
55.99%
jan 1, 1987
13.961
+16.857
-582.02%
jan 1, 1988
9.526
-4.435
-31.77%
jan 1, 1989
-1.144
-10.67
-112.01%
jan 1, 1990
4.584
+5.728
-500.67%
jan 1, 1991
0.84
-3.744
-81.68%
jan 1, 1992
3.087
+2.247
267.55%
jan 1, 1993
-10.188
-13.275
-430.02%
jan 1, 1994
9.324
+19.512
-191.53%
jan 1, 1995
10.214
+0.89
9.54%
jan 1, 1996
8.442
-1.772
-17.35%
jan 1, 1997
6.246
-2.197
-26.02%
jan 1, 1998
3.12
-3.126
-50.04%
jan 1, 1999
8.092
+4.972
159.34%
jan 1, 2000
-0.757
-8.849
-109.36%
jan 1, 2001
8.261
+9.018
-1.19K%
jan 1, 2002
12.382
+4.121
49.88%
jan 1, 2003
-6.121
-18.503
-149.43%
jan 1, 2004
-7.952
-1.831
29.92%
jan 1, 2005
7.335
+15.287
-192.24%
jan 1, 2006
27.799
+20.464
278.98%
jan 1, 2007
31.747
+3.949
14.2%
jan 1, 2008
2.198
-29.549
-93.08%
jan 1, 2009
12.854
+10.656
484.83%
jan 1, 2010
9.969
-2.885
-22.44%
jan 1, 2011
13.853
+3.884
38.96%
jan 1, 2012
4.753
-9.1
-65.69%
jan 1, 2013
12.657
+7.904
166.31%
jan 1, 2014
1.243
-11.414
-90.18%
jan 1, 2015
14.772
+13.529
1.09K%
jan 1, 2016
5.163
-9.609
-65.05%
Ranking of countries by current statistics by years


Comments: