29
/
en
AIzaSyAYiBZKx7MnpbEhh9jyipgxe19OcubqV5w
April 1, 2024
170008
Korea, Rep.
KOR
true
2
1
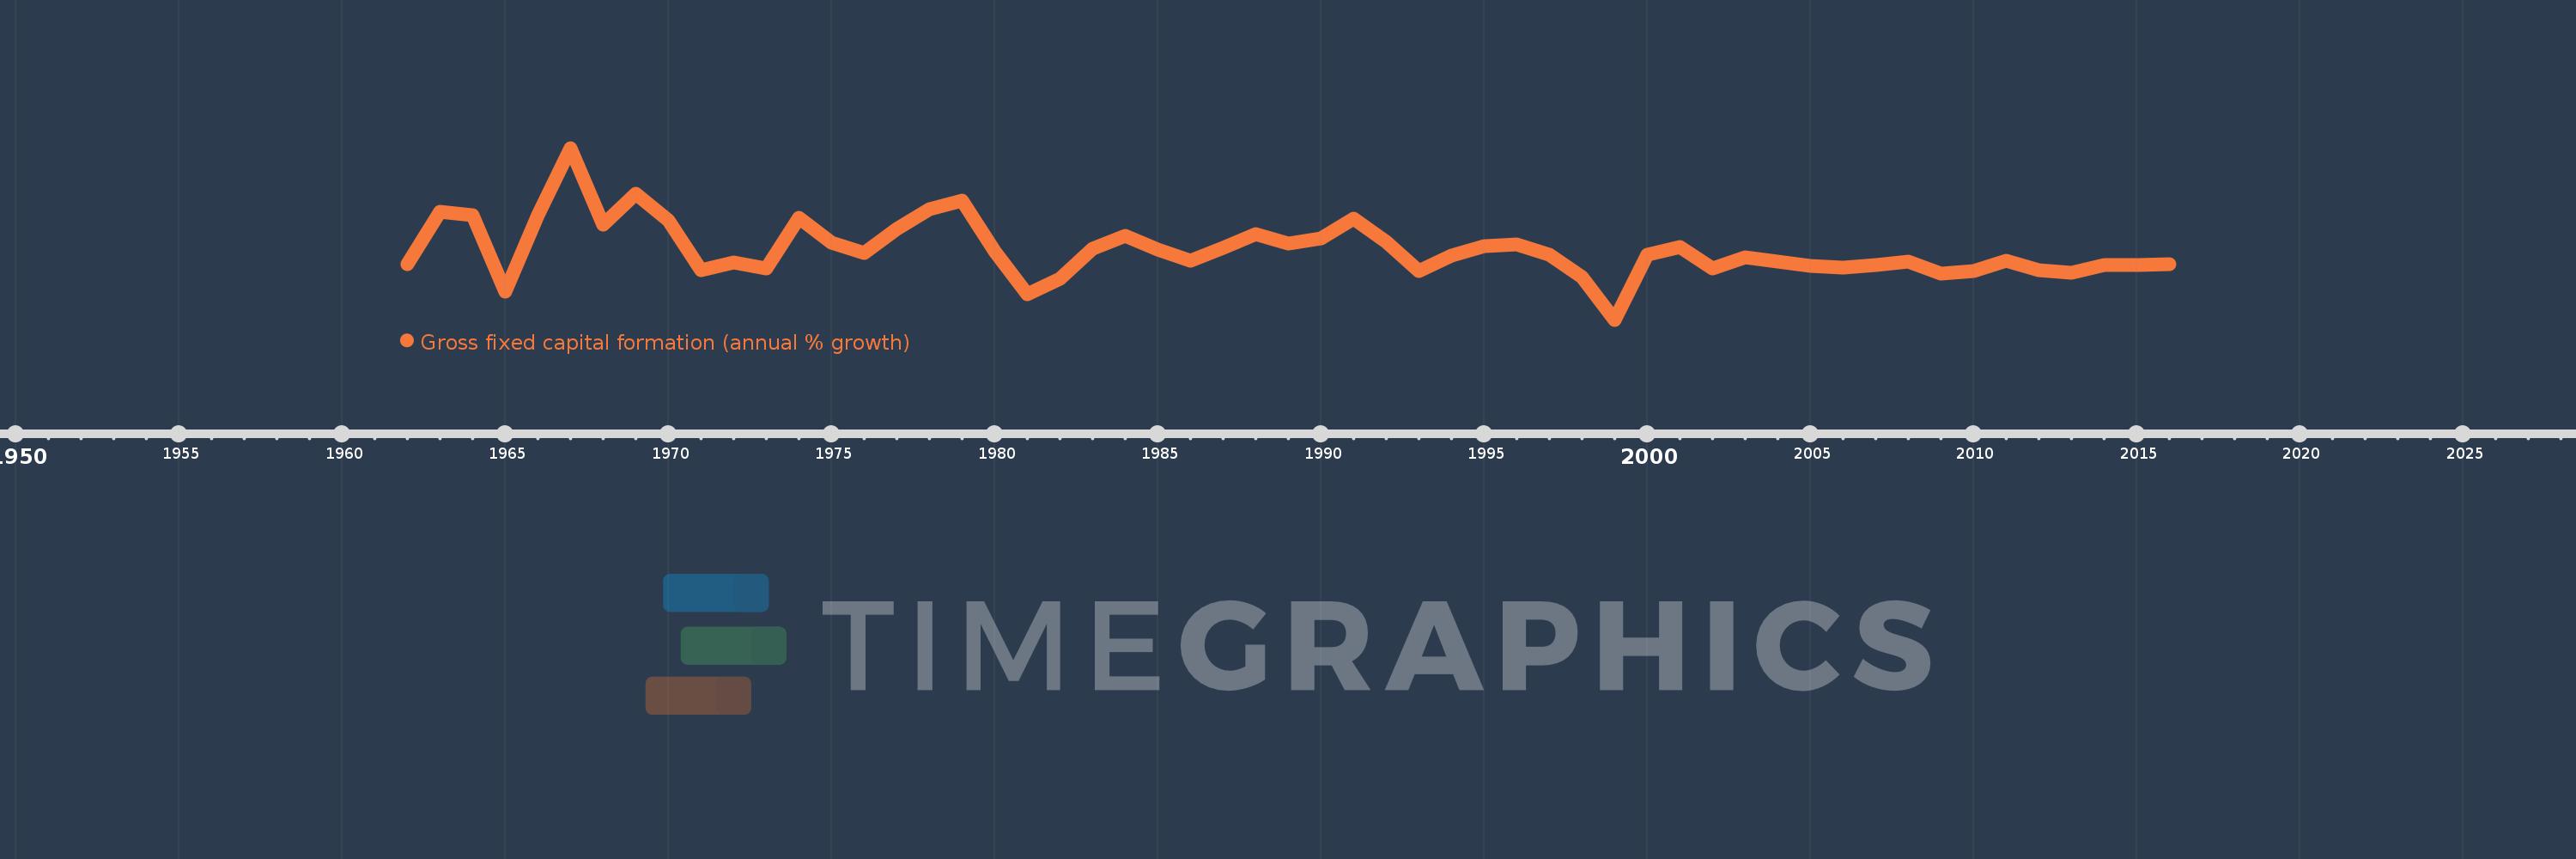
Gross fixed capital formation (annual % growth)
2016,2015,2014,2013,2012,2011,2010,2009,2008,2007,2006,2005,2004,2003,2002,2001,2000,1999,1998,1997,1996,1995,1994,1993,1992,1991,1990,1989,1988,1987,1986,1985,1984,1983,1982,1981,1980,1979,1978,1977,1976,1975,1974,1973,1972,1971,1970,1969,1968,1967,1966,1965,1964,1963,1962
This statistics in other country:
AlbaniaAlgeriaAntigua and BarbudaArab WorldArgentinaArmeniaAustraliaAustriaAzerbaijanBahamas, TheBahrainBangladeshBarbadosBelarusBelgiumBelizeBeninBhutanBoliviaBosnia and HerzegovinaBotswanaBrazilBrunei DarussalamBulgariaBurkina FasoBurundiCabo VerdeCambodiaCameroonCanadaCaribbean small statesCentral Europe and the BalticsChadChileChinaColombiaComorosCongo, Dem. Rep.Congo, Rep.Costa RicaCote d'IvoireCroatiaCubaCyprusCzech RepublicDenmarkDjiboutiDominican RepublicEarly-demographic dividendEast Asia & PacificEast Asia & Pacific (excluding high income)East Asia & Pacific (IDA & IBRD countries)EcuadorEgypt, Arab Rep.El SalvadorEquatorial GuineaEritreaEstoniaEthiopiaEuro areaEurope & Central AsiaEurope & Central Asia (excluding high income)Europe & Central Asia (IDA & IBRD countries)European UnionFinlandFranceGabonGambia, TheGeorgiaGermanyGhanaGreeceGuatemalaGuineaGuinea-BissauHaitiHeavily indebted poor countries (HIPC)High incomeHondurasHong Kong SAR, ChinaHungaryIBRD onlyIcelandIDA & IBRD totalIDA blendIDA onlyIDA totalIndiaIndonesiaIran, Islamic Rep.IrelandIsraelItalyJamaicaJapanJordanKazakhstanKenyaKorea, Rep.KosovoKyrgyz RepublicLao PDRLate-demographic dividendLatin America & Caribbean Latin America & Caribbean (excluding high income)Latin America & the Caribbean (IDA & IBRD countries)LatviaLeast developed countries: UN classificationLebanonLiberiaLithuaniaLow & middle incomeLow incomeLower middle incomeLuxembourgMacao SAR, ChinaMacedonia, FYRMadagascarMalawiMalaysiaMaliMaltaMauritaniaMauritiusMexicoMiddle East & North AfricaMiddle East & North Africa (excluding high income)Middle East & North Africa (IDA & IBRD countries)Middle incomeMoldovaMongoliaMontenegroMoroccoMozambiqueNamibiaNepalNetherlandsNew ZealandNicaraguaNigerNigeriaNorth AmericaNorwayOECD membersOmanPakistanPanamaPapua New GuineaParaguayPeruPhilippinesPolandPortugalPost-demographic dividendPre-demographic dividendPuerto RicoRomaniaRussian FederationRwandaSaudi ArabiaSenegalSerbiaSeychellesSierra LeoneSingaporeSlovak RepublicSloveniaSomaliaSouth AfricaSouth AsiaSouth Asia (IDA & IBRD)South SudanSpainSri LankaSub-Saharan Africa Sub-Saharan Africa (excluding high income)Sub-Saharan Africa (IDA & IBRD countries)SudanSurinameSwazilandSwedenSwitzerlandSyrian Arab RepublicTajikistanTanzaniaThailandTimor-LesteTogoTrinidad and TobagoTunisiaTurkeyUgandaUkraineUnited Arab EmiratesUnited KingdomUnited StatesUpper middle incomeUruguayUzbekistanVanuatuVenezuela, RBVietnamWest Bank and GazaWorldZimbabwe Timeline:
This timeline shows a graph from 1962 to 2016 of Korea, Rep.. No data until 1961. Number of actual observations by date: 55.
Source name:
World Development Indicators
Source organization:
World Bank national accounts data, and OECD National Accounts data files.
Categories, topics:
Economy & Growth
Last updated:
apr 23, 2017
Indicators value changes by year
Minimum:
-22.935
jan 1, 1999
At the date of observation
Value
Absolute change
Change from previous value
jan 1, 1962
3.566
+3.566
0.0%
jan 1, 1963
28.793
+25.227
707.46%
jan 1, 1964
27.301
-1.491
-5.18%
jan 1, 1965
-9.324
-36.626
-134.15%
jan 1, 1966
27.159
+36.484
-391.27%
jan 1, 1967
59.6
+32.441
119.45%
jan 1, 1968
22.6
-37.0
-62.08%
jan 1, 1969
37.4
+14.8
65.49%
jan 1, 1970
24.8
-12.6
-33.69%
jan 1, 1971
0.976
-23.824
-96.06%
jan 1, 1972
4.632
+3.656
374.55%
jan 1, 1973
1.713
-2.918
-63.01%
jan 1, 1974
26.25
+24.537
1.43K%
jan 1, 1975
14.123
-12.127
-46.2%
jan 1, 1976
8.946
-5.177
-36.66%
jan 1, 1977
20.741
+11.795
131.85%
jan 1, 1978
30.166
+9.424
45.44%
jan 1, 1979
34.424
+4.258
14.11%
jan 1, 1980
10.033
-24.39
-70.85%
jan 1, 1981
-10.716
-20.749
-206.8%
jan 1, 1982
-3.091
+7.624
-71.15%
jan 1, 1983
11.117
+14.208
-459.6%
jan 1, 1984
17.448
+6.332
56.96%
jan 1, 1985
10.857
-6.591
-37.77%
jan 1, 1986
5.273
-5.585
-51.44%
jan 1, 1987
11.527
+6.255
118.62%
jan 1, 1988
18.091
+6.564
56.94%
jan 1, 1989
13.622
-4.469
-24.7%
jan 1, 1990
15.99
+2.368
17.39%
jan 1, 1991
25.438
+9.448
59.08%
jan 1, 1992
14.436
-11.002
-43.25%
jan 1, 1993
0.55
-13.886
-96.19%
jan 1, 1994
7.727
+7.177
1.3K%
jan 1, 1995
12.49
+4.763
61.65%
jan 1, 1996
13.1
+0.61
4.88%
jan 1, 1997
8.384
-4.716
-36.0%
jan 1, 1998
-2.298
-10.682
-127.41%
jan 1, 1999
-22.935
-20.637
898.11%
jan 1, 2000
8.341
+31.276
-136.37%
jan 1, 2001
12.207
+3.865
46.34%
jan 1, 2002
1.531
-10.676
-87.46%
jan 1, 2003
6.931
+5.4
352.78%
jan 1, 2004
4.799
-2.132
-30.76%
jan 1, 2005
2.854
-1.945
-40.52%
jan 1, 2006
1.996
-0.858
-30.08%
jan 1, 2007
3.552
+1.557
77.99%
jan 1, 2008
4.988
+1.436
40.41%
jan 1, 2009
-0.851
-5.839
-117.06%
jan 1, 2010
0.297
+1.148
-134.92%
jan 1, 2011
5.517
+5.22
1.76K%
jan 1, 2012
0.829
-4.687
-84.97%
jan 1, 2013
-0.484
-1.314
-158.4%
jan 1, 2014
3.302
+3.786
-781.73%
jan 1, 2015
3.365
+0.063
1.91%
jan 1, 2016
3.842
+0.477
14.19%
Ranking of countries by current statistics by years


Comments: