29
/
en
AIzaSyAYiBZKx7MnpbEhh9jyipgxe19OcubqV5w
April 1, 2024
144431
Guatemala
GTM
true
2
1
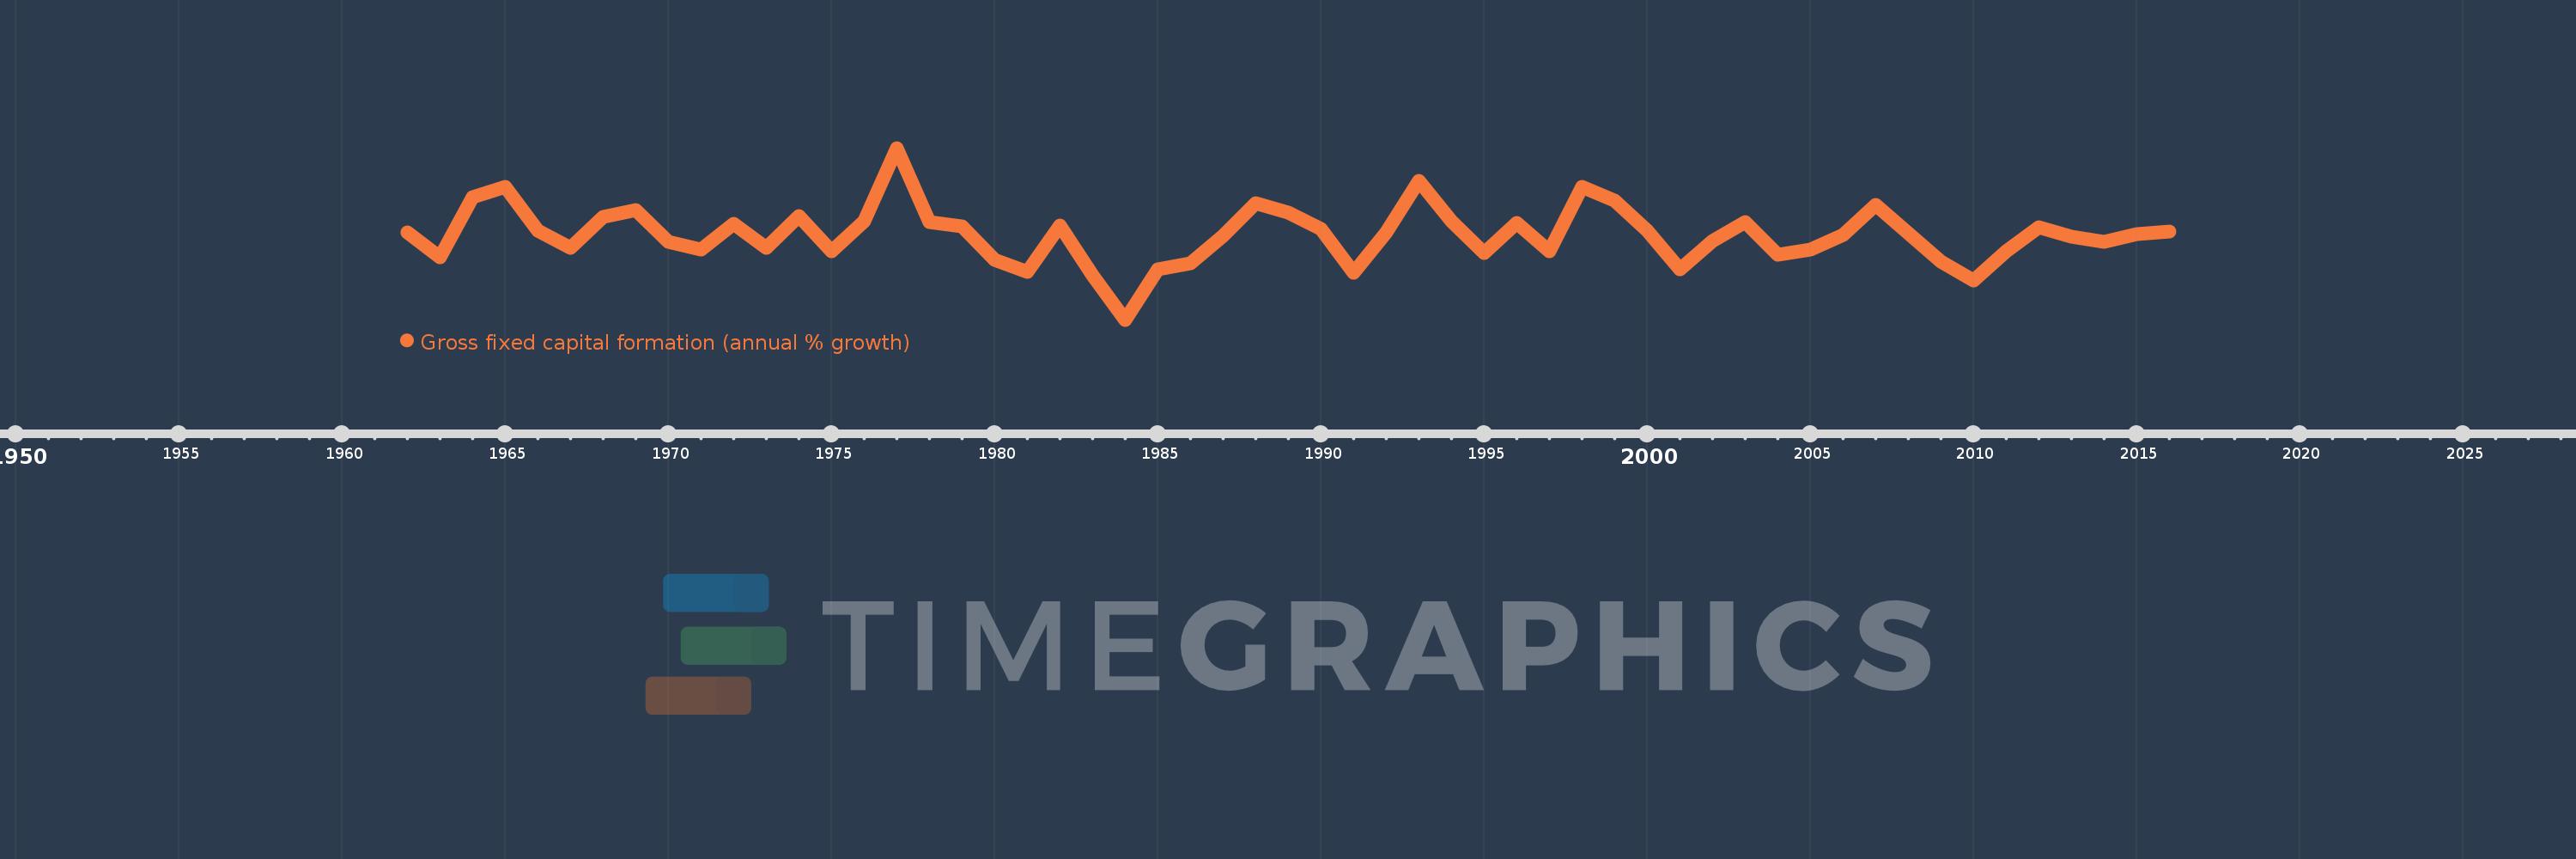
Gross fixed capital formation (annual % growth)
2016,2015,2014,2013,2012,2011,2010,2009,2008,2007,2006,2005,2004,2003,2002,2001,2000,1999,1998,1997,1996,1995,1994,1993,1992,1991,1990,1989,1988,1987,1986,1985,1984,1983,1982,1981,1980,1979,1978,1977,1976,1975,1974,1973,1972,1971,1970,1969,1968,1967,1966,1965,1964,1963,1962
This statistics in other country:
AlbaniaAlgeriaAntigua and BarbudaArab WorldArgentinaArmeniaAustraliaAustriaAzerbaijanBahamas, TheBahrainBangladeshBarbadosBelarusBelgiumBelizeBeninBhutanBoliviaBosnia and HerzegovinaBotswanaBrazilBrunei DarussalamBulgariaBurkina FasoBurundiCabo VerdeCambodiaCameroonCanadaCaribbean small statesCentral Europe and the BalticsChadChileChinaColombiaComorosCongo, Dem. Rep.Congo, Rep.Costa RicaCote d'IvoireCroatiaCubaCyprusCzech RepublicDenmarkDjiboutiDominican RepublicEarly-demographic dividendEast Asia & PacificEast Asia & Pacific (excluding high income)East Asia & Pacific (IDA & IBRD countries)EcuadorEgypt, Arab Rep.El SalvadorEquatorial GuineaEritreaEstoniaEthiopiaEuro areaEurope & Central AsiaEurope & Central Asia (excluding high income)Europe & Central Asia (IDA & IBRD countries)European UnionFinlandFranceGabonGambia, TheGeorgiaGermanyGhanaGreeceGuatemalaGuineaGuinea-BissauHaitiHeavily indebted poor countries (HIPC)High incomeHondurasHong Kong SAR, ChinaHungaryIBRD onlyIcelandIDA & IBRD totalIDA blendIDA onlyIDA totalIndiaIndonesiaIran, Islamic Rep.IrelandIsraelItalyJamaicaJapanJordanKazakhstanKenyaKorea, Rep.KosovoKyrgyz RepublicLao PDRLate-demographic dividendLatin America & Caribbean Latin America & Caribbean (excluding high income)Latin America & the Caribbean (IDA & IBRD countries)LatviaLeast developed countries: UN classificationLebanonLiberiaLithuaniaLow & middle incomeLow incomeLower middle incomeLuxembourgMacao SAR, ChinaMacedonia, FYRMadagascarMalawiMalaysiaMaliMaltaMauritaniaMauritiusMexicoMiddle East & North AfricaMiddle East & North Africa (excluding high income)Middle East & North Africa (IDA & IBRD countries)Middle incomeMoldovaMongoliaMontenegroMoroccoMozambiqueNamibiaNepalNetherlandsNew ZealandNicaraguaNigerNigeriaNorth AmericaNorwayOECD membersOmanPakistanPanamaPapua New GuineaParaguayPeruPhilippinesPolandPortugalPost-demographic dividendPre-demographic dividendPuerto RicoRomaniaRussian FederationRwandaSaudi ArabiaSenegalSerbiaSeychellesSierra LeoneSingaporeSlovak RepublicSloveniaSomaliaSouth AfricaSouth AsiaSouth Asia (IDA & IBRD)South SudanSpainSri LankaSub-Saharan Africa Sub-Saharan Africa (excluding high income)Sub-Saharan Africa (IDA & IBRD countries)SudanSurinameSwazilandSwedenSwitzerlandSyrian Arab RepublicTajikistanTanzaniaThailandTimor-LesteTogoTrinidad and TobagoTunisiaTurkeyUgandaUkraineUnited Arab EmiratesUnited KingdomUnited StatesUpper middle incomeUruguayUzbekistanVanuatuVenezuela, RBVietnamWest Bank and GazaWorldZimbabwe Timeline:
This timeline shows a graph from 1962 to 2016 of Guatemala. No data until 1961. Number of actual observations by date: 55.
Source name:
World Development Indicators
Source organization:
World Bank national accounts data, and OECD National Accounts data files.
Categories, topics:
Economy & Growth
Last updated:
apr 23, 2017
Indicators value changes by year
Minimum:
-27.933
jan 1, 1984
Maximum:
37.251
jan 1, 1977
At the date of observation
Value
Absolute change
Change from previous value
jan 1, 1962
5.288
+5.288
0.0%
jan 1, 1963
-4.229
-9.517
-179.98%
jan 1, 1964
18.491
+22.72
-537.24%
jan 1, 1965
22.516
+4.024
21.76%
jan 1, 1966
5.703
-16.812
-74.67%
jan 1, 1967
-0.54
-6.243
-109.46%
jan 1, 1968
11.031
+11.57
-2.14K%
jan 1, 1969
13.681
+2.65
24.02%
jan 1, 1970
1.576
-12.105
-88.48%
jan 1, 1971
-1.457
-3.033
-192.48%
jan 1, 1972
8.54
+9.998
-685.96%
jan 1, 1973
-0.571
-9.112
-106.69%
jan 1, 1974
11.362
+11.933
-2.09K%
jan 1, 1975
-1.866
-13.227
-116.42%
jan 1, 1976
9.466
+11.332
-607.34%
jan 1, 1977
37.251
+27.785
293.52%
jan 1, 1978
9.262
-27.988
-75.14%
jan 1, 1979
7.368
-1.894
-20.45%
jan 1, 1980
-5.21
-12.578
-170.71%
jan 1, 1981
-9.685
-4.475
85.9%
jan 1, 1982
7.775
+17.46
-180.27%
jan 1, 1983
-10.945
-18.72
-240.78%
jan 1, 1984
-27.933
-16.988
155.21%
jan 1, 1985
-8.915
+19.018
-68.09%
jan 1, 1986
-6.383
+2.532
-28.4%
jan 1, 1987
3.909
+10.292
-161.24%
jan 1, 1988
16.448
+12.539
320.76%
jan 1, 1989
12.622
-3.826
-23.26%
jan 1, 1990
6.371
-6.251
-49.53%
jan 1, 1991
-10.254
-16.625
-260.95%
jan 1, 1992
5.171
+15.425
-150.43%
jan 1, 1993
24.917
+19.746
381.84%
jan 1, 1994
9.529
-15.388
-61.76%
jan 1, 1995
-2.621
-12.15
-127.5%
jan 1, 1996
8.693
+11.314
-431.7%
jan 1, 1997
-1.982
-10.676
-122.8%
jan 1, 1998
22.504
+24.487
-1.24K%
jan 1, 1999
17.426
-5.078
-22.56%
jan 1, 2000
5.807
-11.62
-66.68%
jan 1, 2001
-8.809
-14.616
-251.7%
jan 1, 2002
1.833
+10.642
-120.81%
jan 1, 2003
9.282
+7.449
406.37%
jan 1, 2004
-3.125
-12.407
-133.67%
jan 1, 2005
-1.163
+1.962
-62.79%
jan 1, 2006
4.275
+5.438
-467.74%
jan 1, 2007
15.732
+11.456
267.96%
jan 1, 2008
4.953
-10.779
-68.52%
jan 1, 2009
-5.835
-10.788
-217.82%
jan 1, 2010
-13.129
-7.293
124.98%
jan 1, 2011
-2.066
+11.063
-84.26%
jan 1, 2012
7.105
+9.171
-443.94%
jan 1, 2013
3.609
-3.497
-49.21%
jan 1, 2014
1.489
-2.12
-58.73%
jan 1, 2015
4.434
+2.944
197.7%
jan 1, 2016
5.459
+1.026
23.13%
Ranking of countries by current statistics by years


Comments: