29
/
en
AIzaSyAYiBZKx7MnpbEhh9jyipgxe19OcubqV5w
April 1, 2024
276703
United States
USA
true
2
1
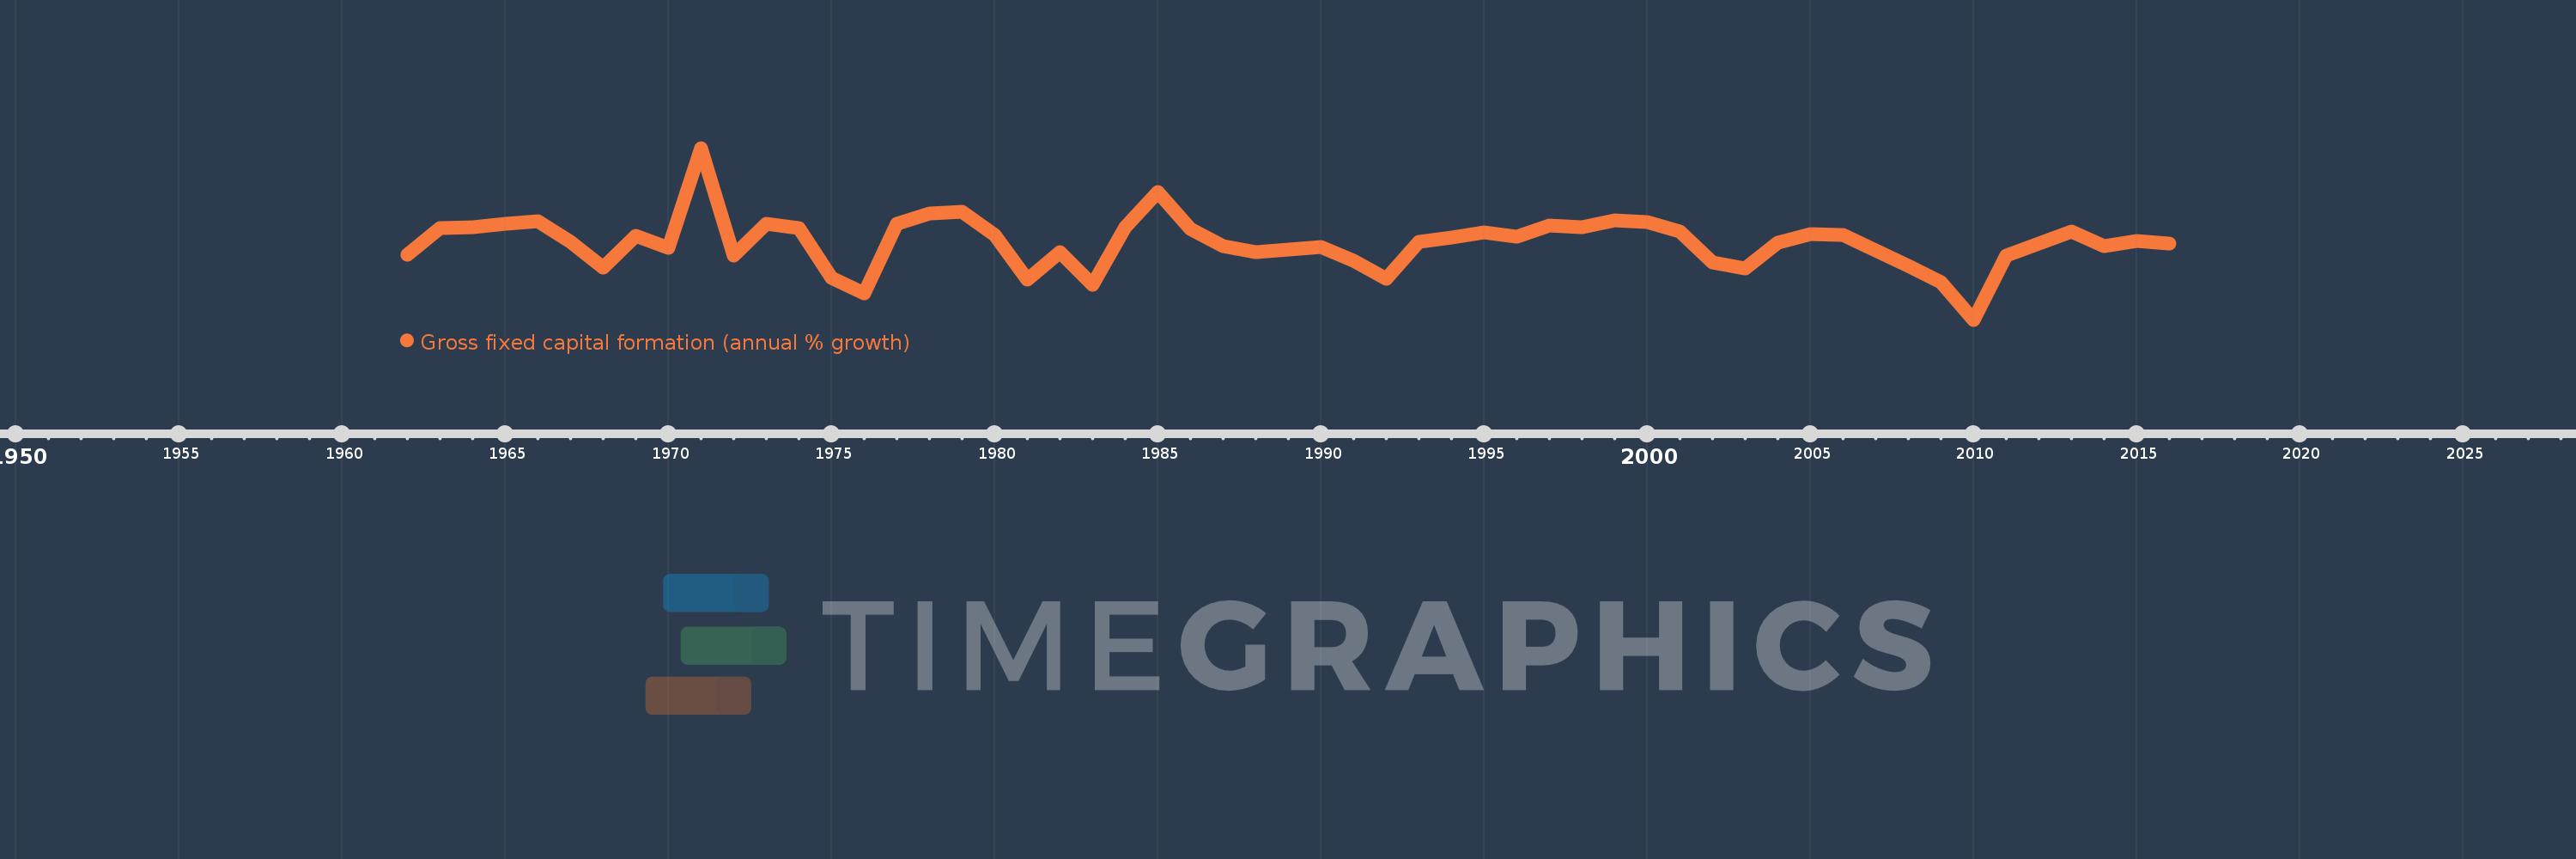
Gross fixed capital formation (annual % growth)
2016,2015,2014,2013,2012,2011,2010,2009,2008,2007,2006,2005,2004,2003,2002,2001,2000,1999,1998,1997,1996,1995,1994,1993,1992,1991,1990,1989,1988,1987,1986,1985,1984,1983,1982,1981,1980,1979,1978,1977,1976,1975,1974,1973,1972,1971,1970,1969,1968,1967,1966,1965,1964,1963,1962
This statistics in other country:
AlbaniaAlgeriaAntigua and BarbudaArab WorldArgentinaArmeniaAustraliaAustriaAzerbaijanBahamas, TheBahrainBangladeshBarbadosBelarusBelgiumBelizeBeninBhutanBoliviaBosnia and HerzegovinaBotswanaBrazilBrunei DarussalamBulgariaBurkina FasoBurundiCabo VerdeCambodiaCameroonCanadaCaribbean small statesCentral Europe and the BalticsChadChileChinaColombiaComorosCongo, Dem. Rep.Congo, Rep.Costa RicaCote d'IvoireCroatiaCubaCyprusCzech RepublicDenmarkDjiboutiDominican RepublicEarly-demographic dividendEast Asia & PacificEast Asia & Pacific (excluding high income)East Asia & Pacific (IDA & IBRD countries)EcuadorEgypt, Arab Rep.El SalvadorEquatorial GuineaEritreaEstoniaEthiopiaEuro areaEurope & Central AsiaEurope & Central Asia (excluding high income)Europe & Central Asia (IDA & IBRD countries)European UnionFinlandFranceGabonGambia, TheGeorgiaGermanyGhanaGreeceGuatemalaGuineaGuinea-BissauHaitiHeavily indebted poor countries (HIPC)High incomeHondurasHong Kong SAR, ChinaHungaryIBRD onlyIcelandIDA & IBRD totalIDA blendIDA onlyIDA totalIndiaIndonesiaIran, Islamic Rep.IrelandIsraelItalyJamaicaJapanJordanKazakhstanKenyaKorea, Rep.KosovoKyrgyz RepublicLao PDRLate-demographic dividendLatin America & Caribbean Latin America & Caribbean (excluding high income)Latin America & the Caribbean (IDA & IBRD countries)LatviaLeast developed countries: UN classificationLebanonLiberiaLithuaniaLow & middle incomeLow incomeLower middle incomeLuxembourgMacao SAR, ChinaMacedonia, FYRMadagascarMalawiMalaysiaMaliMaltaMauritaniaMauritiusMexicoMiddle East & North AfricaMiddle East & North Africa (excluding high income)Middle East & North Africa (IDA & IBRD countries)Middle incomeMoldovaMongoliaMontenegroMoroccoMozambiqueNamibiaNepalNetherlandsNew ZealandNicaraguaNigerNigeriaNorth AmericaNorwayOECD membersOmanPakistanPanamaPapua New GuineaParaguayPeruPhilippinesPolandPortugalPost-demographic dividendPre-demographic dividendPuerto RicoRomaniaRussian FederationRwandaSaudi ArabiaSenegalSerbiaSeychellesSierra LeoneSingaporeSlovak RepublicSloveniaSomaliaSouth AfricaSouth AsiaSouth Asia (IDA & IBRD)South SudanSpainSri LankaSub-Saharan Africa Sub-Saharan Africa (excluding high income)Sub-Saharan Africa (IDA & IBRD countries)SudanSurinameSwazilandSwedenSwitzerlandSyrian Arab RepublicTajikistanTanzaniaThailandTimor-LesteTogoTrinidad and TobagoTunisiaTurkeyUgandaUkraineUnited Arab EmiratesUnited KingdomUnited StatesUpper middle incomeUruguayUzbekistanVanuatuVenezuela, RBVietnamWest Bank and GazaWorldZimbabwe Timeline:
This timeline shows a graph from 1962 to 2016 of United States. No data until 1961. Number of actual observations by date: 55.
Source name:
World Development Indicators
Source organization:
World Bank national accounts data, and OECD National Accounts data files.
Categories, topics:
Economy & Growth
Last updated:
apr 23, 2017
Indicators value changes by year
Minimum:
-13.07
jan 1, 2010
Maximum:
24.765
jan 1, 1971
At the date of observation
Value
Absolute change
Change from previous value
jan 1, 1962
1.261
+1.261
0.0%
jan 1, 1963
7.108
+5.847
463.68%
jan 1, 1964
7.359
+0.251
3.53%
jan 1, 1965
8.115
+0.757
10.29%
jan 1, 1966
8.569
+0.453
5.58%
jan 1, 1967
4.085
-4.483
-52.32%
jan 1, 1968
-1.608
-5.693
-139.36%
jan 1, 1969
5.5
+7.108
-442.05%
jan 1, 1970
2.815
-2.685
-48.82%
jan 1, 1971
24.765
+21.95
779.81%
jan 1, 1972
1.035
-23.73
-95.82%
jan 1, 1973
8.031
+6.996
675.9%
jan 1, 1974
7.041
-0.989
-12.32%
jan 1, 1975
-3.87
-10.912
-154.96%
jan 1, 1976
-7.353
-3.483
89.99%
jan 1, 1977
7.969
+15.322
-208.38%
jan 1, 1978
10.312
+2.343
29.4%
jan 1, 1979
10.668
+0.356
3.46%
jan 1, 1980
5.693
-4.975
-46.64%
jan 1, 1981
-4.284
-9.977
-175.25%
jan 1, 1982
1.889
+6.173
-144.1%
jan 1, 1983
-5.378
-7.267
-384.71%
jan 1, 1984
7.316
+12.694
-236.02%
jan 1, 1985
15.043
+7.727
105.63%
jan 1, 1986
7.006
-8.037
-53.43%
jan 1, 1987
3.109
-3.897
-55.62%
jan 1, 1988
1.787
-1.322
-42.52%
jan 1, 1989
2.358
+0.571
31.95%
jan 1, 1990
2.936
+0.578
24.53%
jan 1, 1991
-0.1
-3.037
-103.41%
jan 1, 1992
-4.137
-4.037
4.03K%
jan 1, 1993
4.143
+8.281
-200.14%
jan 1, 1994
5.108
+0.965
23.28%
jan 1, 1995
6.11
+1.002
19.61%
jan 1, 1996
5.178
-0.931
-15.24%
jan 1, 1997
7.683
+2.504
48.36%
jan 1, 1998
7.398
-0.285
-3.71%
jan 1, 1999
8.898
+1.5
20.28%
jan 1, 2000
8.346
-0.551
-6.2%
jan 1, 2001
6.314
-2.032
-24.35%
jan 1, 2002
-0.54
-6.854
-108.55%
jan 1, 2003
-1.764
-1.224
226.79%
jan 1, 2004
3.923
+5.687
-322.41%
jan 1, 2005
5.803
+1.88
47.92%
jan 1, 2006
5.602
-0.201
-3.46%
jan 1, 2007
2.178
-3.424
-61.12%
jan 1, 2008
-1.24
-3.418
-156.92%
jan 1, 2009
-4.843
-3.603
290.61%
jan 1, 2010
-13.07
-8.227
169.86%
jan 1, 2011
1.118
+14.188
-108.56%
jan 1, 2012
3.696
+2.578
230.56%
jan 1, 2013
6.274
+2.578
69.73%
jan 1, 2014
3.05
-3.225
-51.39%
jan 1, 2015
4.237
+1.188
38.94%
jan 1, 2016
3.75
-0.487
-11.5%
Ranking of countries by current statistics by years


Comments: