29
/
en
AIzaSyAYiBZKx7MnpbEhh9jyipgxe19OcubqV5w
April 1, 2024
225960
Portugal
PRT
true
2
1
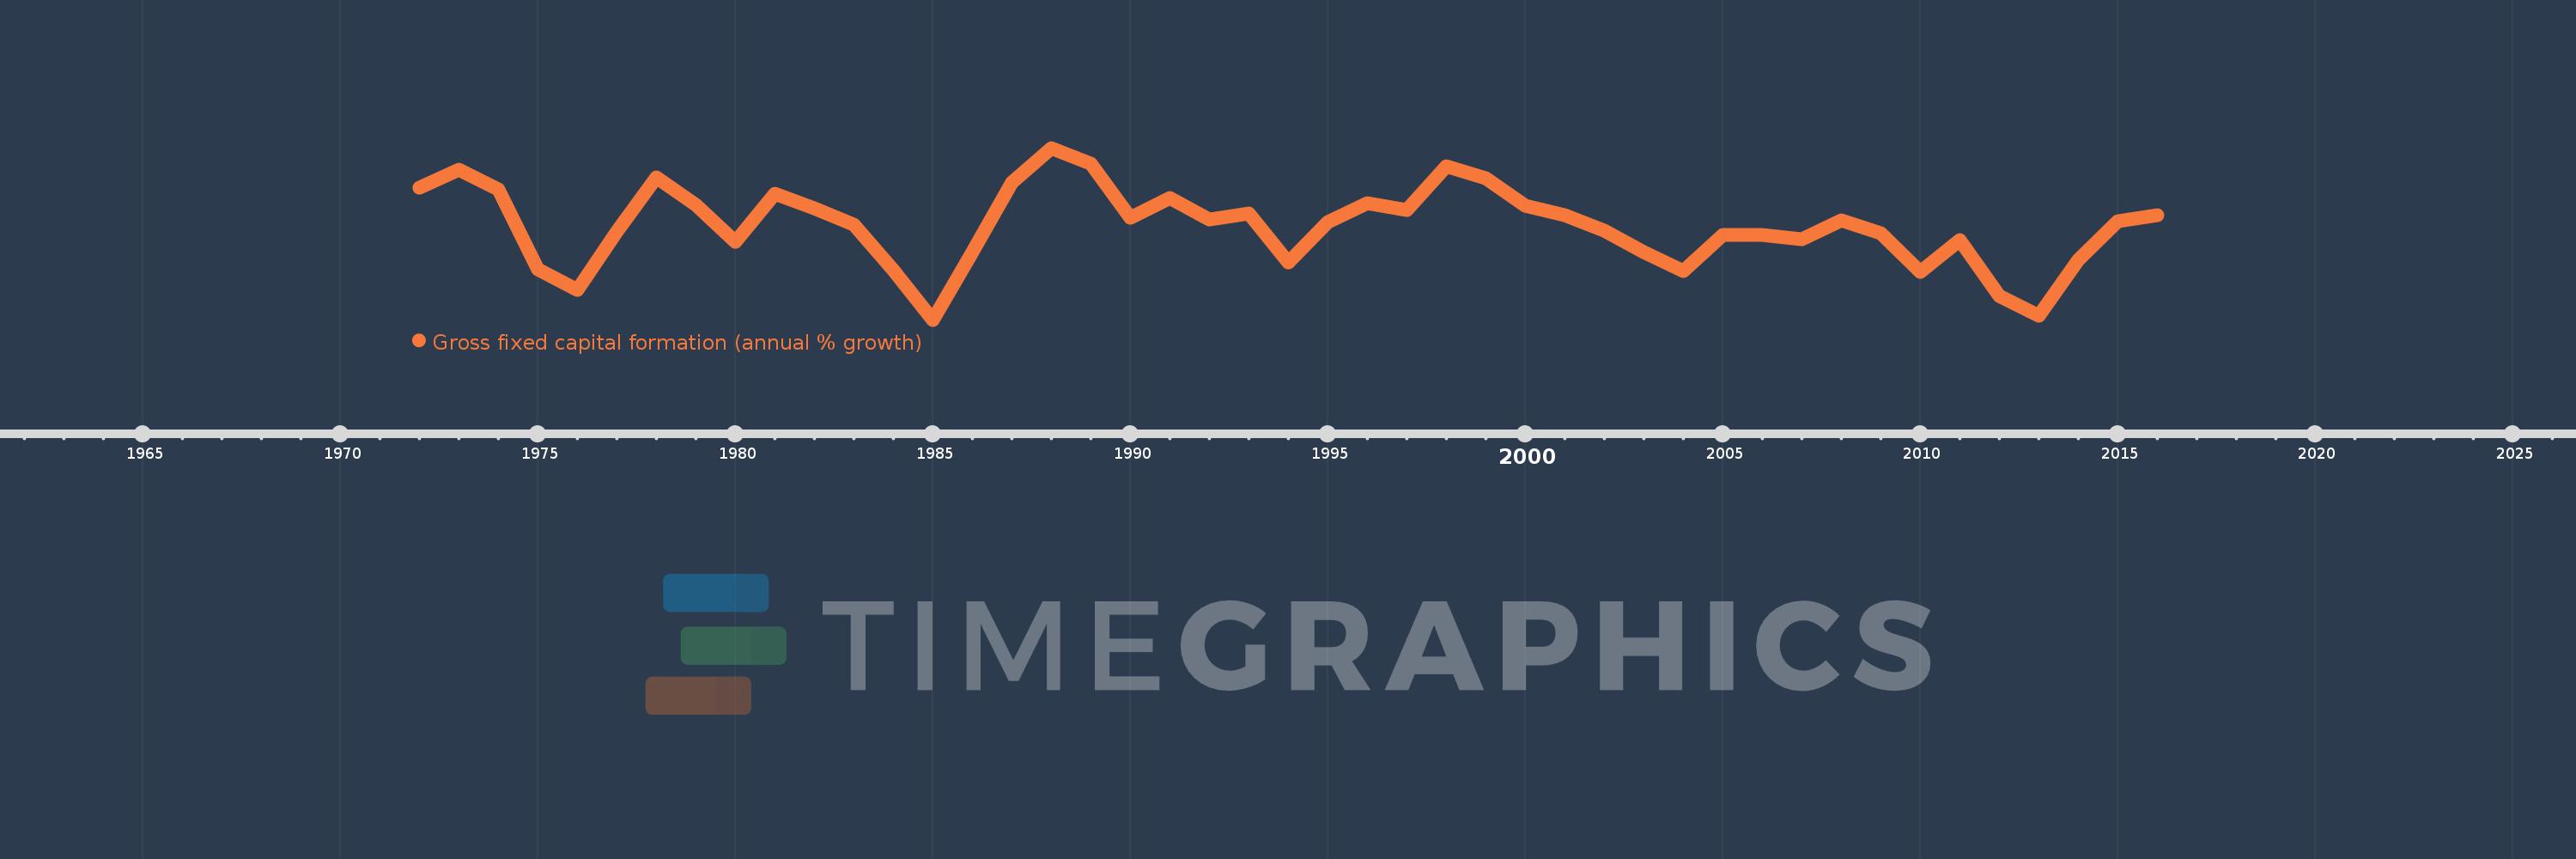
Gross fixed capital formation (annual % growth)
2016,2015,2014,2013,2012,2011,2010,2009,2008,2007,2006,2005,2004,2003,2002,2001,2000,1999,1998,1997,1996,1995,1994,1993,1992,1991,1990,1989,1988,1987,1986,1985,1984,1983,1982,1981,1980,1979,1978,1977,1976,1975,1974,1973,1972
This statistics in other country:
AlbaniaAlgeriaAntigua and BarbudaArab WorldArgentinaArmeniaAustraliaAustriaAzerbaijanBahamas, TheBahrainBangladeshBarbadosBelarusBelgiumBelizeBeninBhutanBoliviaBosnia and HerzegovinaBotswanaBrazilBrunei DarussalamBulgariaBurkina FasoBurundiCabo VerdeCambodiaCameroonCanadaCaribbean small statesCentral Europe and the BalticsChadChileChinaColombiaComorosCongo, Dem. Rep.Congo, Rep.Costa RicaCote d'IvoireCroatiaCubaCyprusCzech RepublicDenmarkDjiboutiDominican RepublicEarly-demographic dividendEast Asia & PacificEast Asia & Pacific (excluding high income)East Asia & Pacific (IDA & IBRD countries)EcuadorEgypt, Arab Rep.El SalvadorEquatorial GuineaEritreaEstoniaEthiopiaEuro areaEurope & Central AsiaEurope & Central Asia (excluding high income)Europe & Central Asia (IDA & IBRD countries)European UnionFinlandFranceGabonGambia, TheGeorgiaGermanyGhanaGreeceGuatemalaGuineaGuinea-BissauHaitiHeavily indebted poor countries (HIPC)High incomeHondurasHong Kong SAR, ChinaHungaryIBRD onlyIcelandIDA & IBRD totalIDA blendIDA onlyIDA totalIndiaIndonesiaIran, Islamic Rep.IrelandIsraelItalyJamaicaJapanJordanKazakhstanKenyaKorea, Rep.KosovoKyrgyz RepublicLao PDRLate-demographic dividendLatin America & Caribbean Latin America & Caribbean (excluding high income)Latin America & the Caribbean (IDA & IBRD countries)LatviaLeast developed countries: UN classificationLebanonLiberiaLithuaniaLow & middle incomeLow incomeLower middle incomeLuxembourgMacao SAR, ChinaMacedonia, FYRMadagascarMalawiMalaysiaMaliMaltaMauritaniaMauritiusMexicoMiddle East & North AfricaMiddle East & North Africa (excluding high income)Middle East & North Africa (IDA & IBRD countries)Middle incomeMoldovaMongoliaMontenegroMoroccoMozambiqueNamibiaNepalNetherlandsNew ZealandNicaraguaNigerNigeriaNorth AmericaNorwayOECD membersOmanPakistanPanamaPapua New GuineaParaguayPeruPhilippinesPolandPortugalPost-demographic dividendPre-demographic dividendPuerto RicoRomaniaRussian FederationRwandaSaudi ArabiaSenegalSerbiaSeychellesSierra LeoneSingaporeSlovak RepublicSloveniaSomaliaSouth AfricaSouth AsiaSouth Asia (IDA & IBRD)South SudanSpainSri LankaSub-Saharan Africa Sub-Saharan Africa (excluding high income)Sub-Saharan Africa (IDA & IBRD countries)SudanSurinameSwazilandSwedenSwitzerlandSyrian Arab RepublicTajikistanTanzaniaThailandTimor-LesteTogoTrinidad and TobagoTunisiaTurkeyUgandaUkraineUnited Arab EmiratesUnited KingdomUnited StatesUpper middle incomeUruguayUzbekistanVanuatuVenezuela, RBVietnamWest Bank and GazaWorldZimbabwe Timeline:
This timeline shows a graph from 1972 to 2016 of Portugal. No data until 1971. Number of actual observations by date: 45.
Source name:
World Development Indicators
Source organization:
World Bank national accounts data, and OECD National Accounts data files.
Categories, topics:
Economy & Growth
Last updated:
apr 23, 2017
Indicators value changes by year
Minimum:
-17.386
jan 1, 1985
Maximum:
17.997
jan 1, 1988
At the date of observation
Value
Absolute change
Change from previous value
jan 1, 1972
9.826
+9.826
0.0%
jan 1, 1973
13.509
+3.683
37.48%
jan 1, 1974
9.527
-3.981
-29.47%
jan 1, 1975
-6.955
-16.482
-173.0%
jan 1, 1976
-11.303
-4.348
62.51%
jan 1, 1977
0.82
+12.124
-107.26%
jan 1, 1978
12.001
+11.181
1.36K%
jan 1, 1979
6.215
-5.786
-48.22%
jan 1, 1980
-1.344
-7.559
-121.63%
jan 1, 1981
8.536
+9.88
-734.87%
jan 1, 1982
5.503
-3.032
-35.52%
jan 1, 1983
2.257
-3.246
-58.98%
jan 1, 1984
-7.132
-9.389
-415.93%
jan 1, 1985
-17.386
-10.254
143.78%
jan 1, 1986
-3.547
+13.839
-79.6%
jan 1, 1987
10.871
+14.418
-406.48%
jan 1, 1988
17.997
+7.126
65.56%
jan 1, 1989
14.833
-3.165
-17.58%
jan 1, 1990
3.657
-11.175
-75.34%
jan 1, 1991
7.607
+3.95
108.0%
jan 1, 1992
3.328
-4.279
-56.25%
jan 1, 1993
4.524
+1.196
35.92%
jan 1, 1994
-5.543
-10.067
-222.53%
jan 1, 1995
2.722
+8.265
-149.11%
jan 1, 1996
6.551
+3.828
140.62%
jan 1, 1997
5.118
-1.433
-21.87%
jan 1, 1998
14.258
+9.14
178.58%
jan 1, 1999
11.74
-2.517
-17.66%
jan 1, 2000
6.079
-5.661
-48.22%
jan 1, 2001
4.071
-2.008
-33.03%
jan 1, 2002
0.961
-3.11
-76.38%
jan 1, 2003
-3.379
-4.341
-451.52%
jan 1, 2004
-7.315
-3.936
116.47%
jan 1, 2005
0.144
+7.46
-101.97%
jan 1, 2006
0.094
-0.05
-35.01%
jan 1, 2007
-0.846
-0.94
-1.0K%
jan 1, 2008
3.102
+3.948
-466.63%
jan 1, 2009
0.369
-2.733
-88.11%
jan 1, 2010
-7.57
-7.939
-2.15K%
jan 1, 2011
-0.941
+6.629
-87.57%
jan 1, 2012
-12.517
-11.576
1.23K%
jan 1, 2013
-16.622
-4.105
32.8%
jan 1, 2014
-5.055
+11.566
-69.59%
jan 1, 2015
2.818
+7.873
-155.74%
jan 1, 2016
4.13
+1.312
46.58%
Ranking of countries by current statistics by years


Comments: