29
/
en
AIzaSyAYiBZKx7MnpbEhh9jyipgxe19OcubqV5w
April 1, 2024
85972
Bhutan
BTN
true
2
1
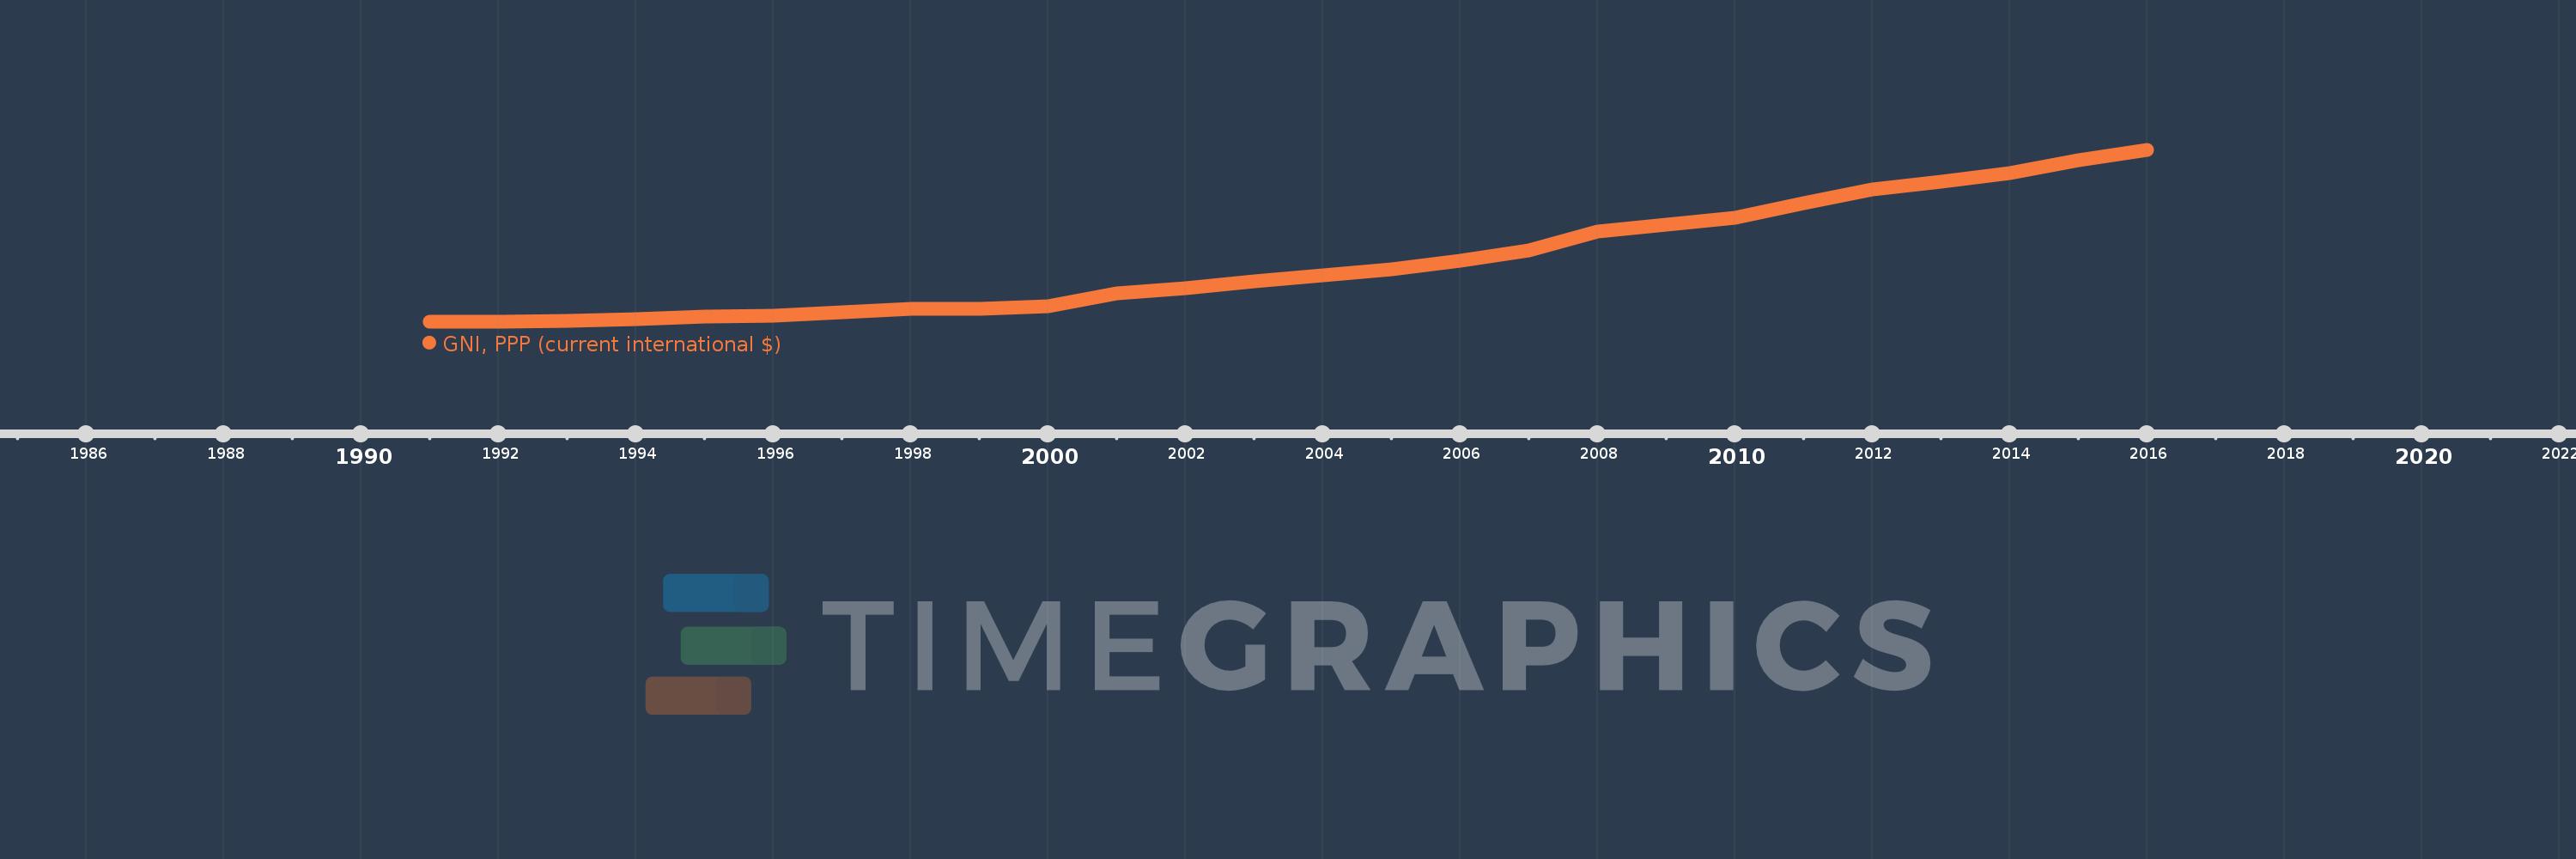
GNI, PPP (current international $)
2016,2015,2014,2013,2012,2011,2010,2009,2008,2007,2006,2005,2004,2003,2002,2001,2000,1999,1998,1997,1996,1995,1994,1993,1992,1991
This statistics in other country:
AfghanistanAlbaniaAlgeriaAngolaAntigua and BarbudaArab WorldArgentinaArmeniaAustraliaAustriaAzerbaijanBahamas, TheBahrainBangladeshBarbadosBelarusBelgiumBelizeBeninBermudaBhutanBoliviaBosnia and HerzegovinaBotswanaBrazilBrunei DarussalamBulgariaBurkina FasoBurundiCabo VerdeCambodiaCameroonCanadaCaribbean small statesCentral African RepublicCentral Europe and the BalticsChadChileChinaColombiaComorosCongo, Dem. Rep.Congo, Rep.Costa RicaCote d'IvoireCroatiaCubaCyprusCzech RepublicDenmarkDjiboutiDominicaDominican RepublicEarly-demographic dividendEast Asia & PacificEast Asia & Pacific (excluding high income)East Asia & Pacific (IDA & IBRD countries)EcuadorEgypt, Arab Rep.El SalvadorEquatorial GuineaEritreaEstoniaEthiopiaEuro areaEurope & Central AsiaEurope & Central Asia (excluding high income)Europe & Central Asia (IDA & IBRD countries)European UnionFijiFinlandFragile and conflict affected situationsFranceGabonGambia, TheGeorgiaGermanyGhanaGreeceGrenadaGuatemalaGuineaGuinea-BissauGuyanaHaitiHeavily indebted poor countries (HIPC)High incomeHondurasHong Kong SAR, ChinaHungaryIBRD onlyIcelandIDA & IBRD totalIDA blendIDA onlyIDA totalIndiaIndonesiaIran, Islamic Rep.IraqIrelandIsraelItalyJamaicaJapanJordanKazakhstanKenyaKiribatiKorea, Rep.KosovoKuwaitKyrgyz RepublicLao PDRLate-demographic dividendLatin America & Caribbean Latin America & Caribbean (excluding high income)Latin America & the Caribbean (IDA & IBRD countries)LatviaLeast developed countries: UN classificationLebanonLesothoLiberiaLibyaLithuaniaLow & middle incomeLow incomeLower middle incomeLuxembourgMacao SAR, ChinaMacedonia, FYRMadagascarMalawiMalaysiaMaldivesMaliMaltaMarshall IslandsMauritaniaMauritiusMexicoMicronesia, Fed. Sts.Middle East & North AfricaMiddle East & North Africa (excluding high income)Middle East & North Africa (IDA & IBRD countries)Middle incomeMoldovaMongoliaMontenegroMoroccoMozambiqueMyanmarNamibiaNauruNepalNetherlandsNew ZealandNicaraguaNigerNigeriaNorth AmericaNorwayOECD membersOmanOther small statesPacific island small statesPakistanPalauPanamaPapua New GuineaParaguayPeruPhilippinesPolandPortugalPost-demographic dividendPre-demographic dividendPuerto RicoQatarRomaniaRussian FederationRwandaSamoaSao Tome and PrincipeSaudi ArabiaSenegalSerbiaSeychellesSierra LeoneSingaporeSlovak RepublicSloveniaSmall statesSolomon IslandsSouth AfricaSouth AsiaSouth Asia (IDA & IBRD)South SudanSpainSri LankaSt. Kitts and NevisSt. LuciaSt. Vincent and the GrenadinesSub-Saharan Africa Sub-Saharan Africa (excluding high income)Sub-Saharan Africa (IDA & IBRD countries)SudanSurinameSwazilandSwedenSwitzerlandTajikistanTanzaniaThailandTimor-LesteTogoTongaTrinidad and TobagoTunisiaTurkeyTurkmenistanTuvaluUgandaUkraineUnited Arab EmiratesUnited KingdomUnited StatesUpper middle incomeUruguayUzbekistanVanuatuVenezuela, RBVietnamWest Bank and GazaWorldYemen, Rep.ZambiaZimbabwe Timeline:
This timeline shows a graph from 1991 to 2016 of Bhutan. No data until 1990. Number of actual observations by date: 26.
Source name:
World Development Indicators
Source organization:
World Bank, International Comparison Program database.
Categories, topics:
Economy & Growth
Last updated:
apr 23, 2017
Indicators value changes by year
Minimum:
757.306 mln
jan 1, 1991
Maximum:
5.91 bln
jan 1, 2016
At the date of observation
Value
Absolute change
Change from previous value
jan 1, 1991
757.306 mln
+757.306 mln
0.0%
jan 1, 1992
759.159 mln
+1.853 mln
0.24%
jan 1, 1993
788.607 mln
+29.449 mln
3.88%
jan 1, 1994
833.187 mln
+44.579 mln
5.65%
jan 1, 1995
920.656 mln
+87.469 mln
10.5%
jan 1, 1996
953.87 mln
+33.215 mln
3.61%
jan 1, 1997
1.039 bln
+85.129 mln
8.92%
jan 1, 1998
1.145 bln
+106.318 mln
10.23%
jan 1, 1999
1.141 bln
-4.297 mln
-0.38%
jan 1, 2000
1.219 bln
+78.348 mln
6.87%
jan 1, 2001
1.607 bln
+387.209 mln
31.75%
jan 1, 2002
1.779 bln
+172.539 mln
10.74%
jan 1, 2003
1.971 bln
+192.128 mln
10.8%
jan 1, 2004
2.149 bln
+177.577 mln
9.01%
jan 1, 2005
2.337 bln
+187.938 mln
8.75%
jan 1, 2006
2.607 bln
+269.741 mln
11.54%
jan 1, 2007
2.9 bln
+293.696 mln
11.27%
jan 1, 2008
3.478 bln
+577.838 mln
19.92%
jan 1, 2009
3.664 bln
+185.758 mln
5.34%
jan 1, 2010
3.885 bln
+221.172 mln
6.04%
jan 1, 2011
4.323 bln
+437.79 mln
11.27%
jan 1, 2012
4.724 bln
+401.684 mln
9.29%
jan 1, 2013
4.973 bln
+248.286 mln
5.26%
jan 1, 2014
5.213 bln
+240.549 mln
4.84%
jan 1, 2015
5.61 bln
+396.565 mln
7.61%
jan 1, 2016
5.91 bln
+300.632 mln
5.36%
Ranking of countries by current statistics by years


Comments: