29
/
en
AIzaSyAYiBZKx7MnpbEhh9jyipgxe19OcubqV5w
April 1, 2024
33454
European Union
EUU
false
2
1
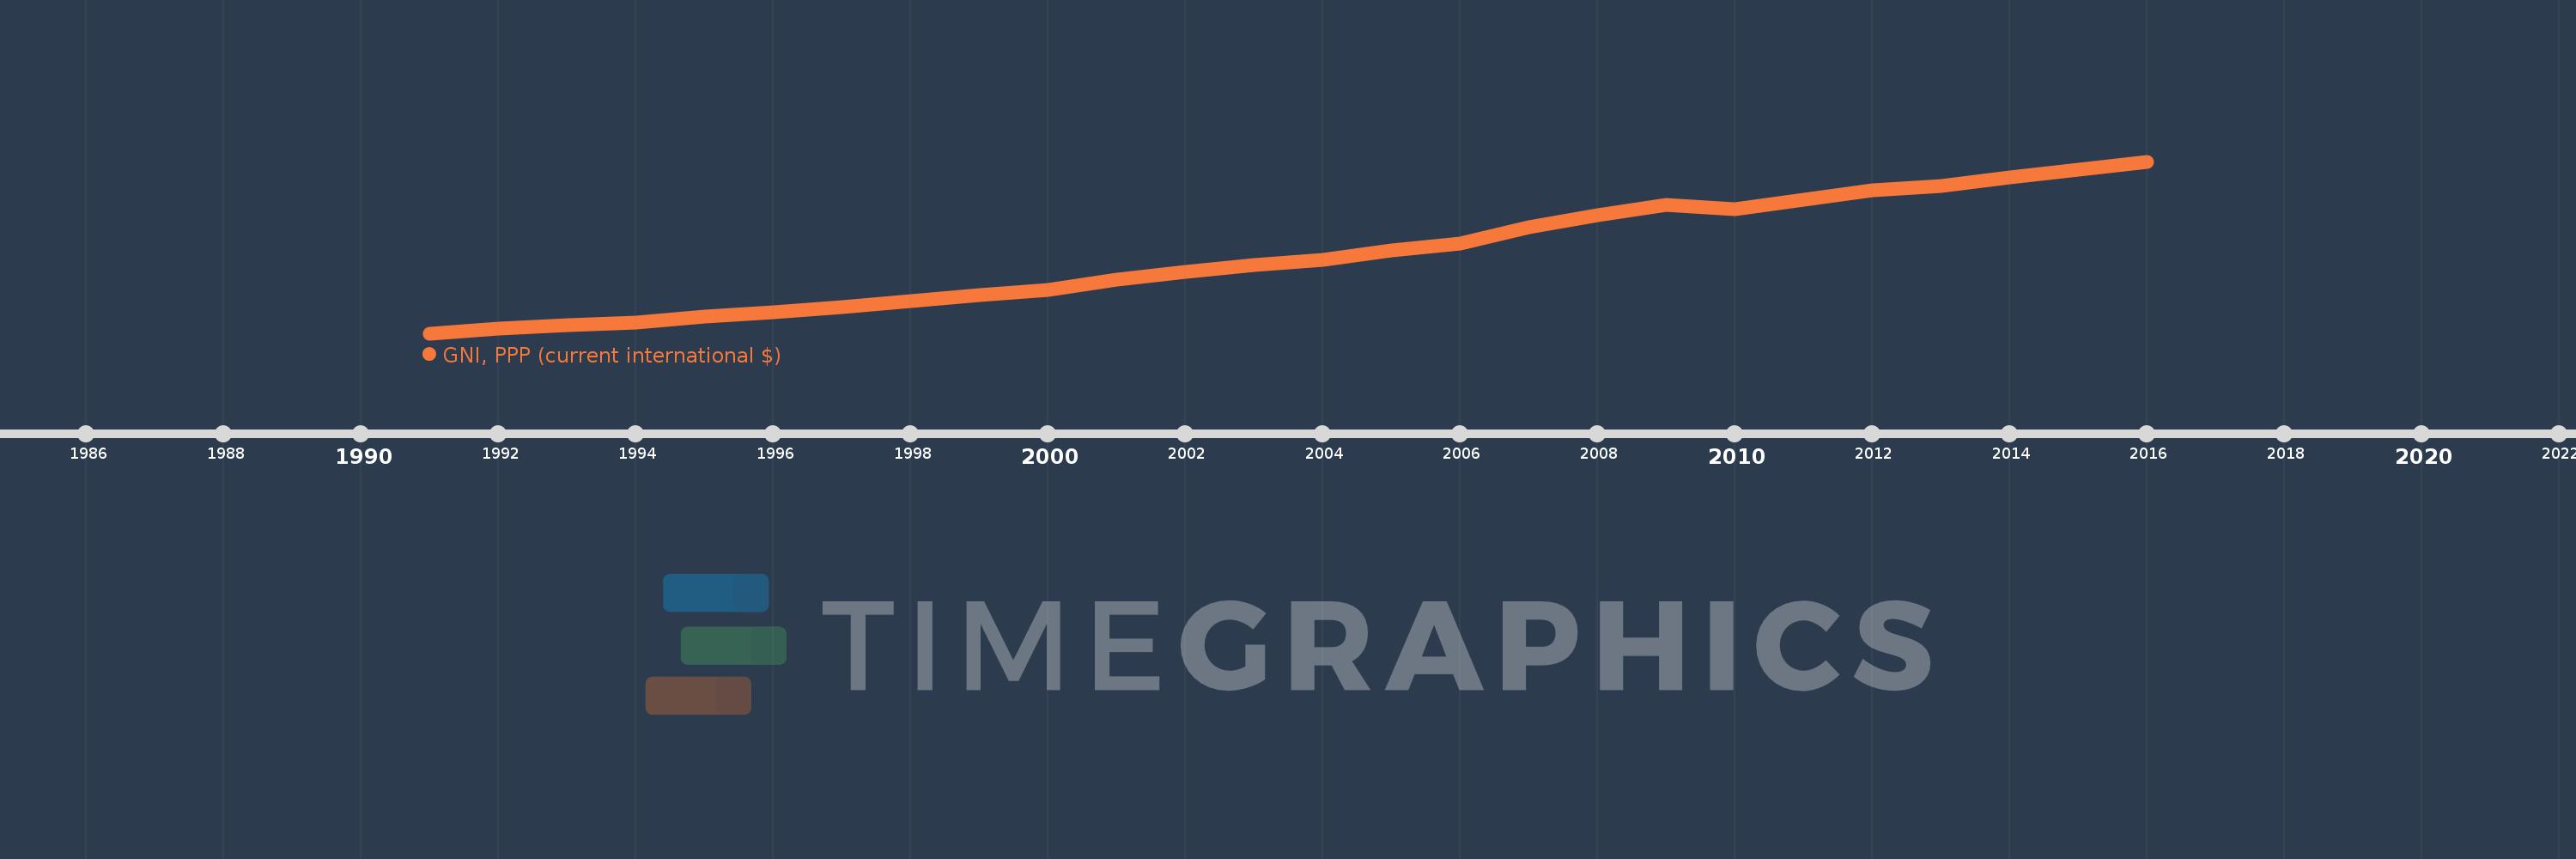
GNI, PPP (current international $)
2016,2015,2014,2013,2012,2011,2010,2009,2008,2007,2006,2005,2004,2003,2002,2001,2000,1999,1998,1997,1996,1995,1994,1993,1992,1991
This statistics in other country:
AfghanistanAlbaniaAlgeriaAngolaAntigua and BarbudaArab WorldArgentinaArmeniaAustraliaAustriaAzerbaijanBahamas, TheBahrainBangladeshBarbadosBelarusBelgiumBelizeBeninBermudaBhutanBoliviaBosnia and HerzegovinaBotswanaBrazilBrunei DarussalamBulgariaBurkina FasoBurundiCabo VerdeCambodiaCameroonCanadaCaribbean small statesCentral African RepublicCentral Europe and the BalticsChadChileChinaColombiaComorosCongo, Dem. Rep.Congo, Rep.Costa RicaCote d'IvoireCroatiaCubaCyprusCzech RepublicDenmarkDjiboutiDominicaDominican RepublicEarly-demographic dividendEast Asia & PacificEast Asia & Pacific (excluding high income)East Asia & Pacific (IDA & IBRD countries)EcuadorEgypt, Arab Rep.El SalvadorEquatorial GuineaEritreaEstoniaEthiopiaEuro areaEurope & Central AsiaEurope & Central Asia (excluding high income)Europe & Central Asia (IDA & IBRD countries)European UnionFijiFinlandFragile and conflict affected situationsFranceGabonGambia, TheGeorgiaGermanyGhanaGreeceGrenadaGuatemalaGuineaGuinea-BissauGuyanaHaitiHeavily indebted poor countries (HIPC)High incomeHondurasHong Kong SAR, ChinaHungaryIBRD onlyIcelandIDA & IBRD totalIDA blendIDA onlyIDA totalIndiaIndonesiaIran, Islamic Rep.IraqIrelandIsraelItalyJamaicaJapanJordanKazakhstanKenyaKiribatiKorea, Rep.KosovoKuwaitKyrgyz RepublicLao PDRLate-demographic dividendLatin America & Caribbean Latin America & Caribbean (excluding high income)Latin America & the Caribbean (IDA & IBRD countries)LatviaLeast developed countries: UN classificationLebanonLesothoLiberiaLibyaLithuaniaLow & middle incomeLow incomeLower middle incomeLuxembourgMacao SAR, ChinaMacedonia, FYRMadagascarMalawiMalaysiaMaldivesMaliMaltaMarshall IslandsMauritaniaMauritiusMexicoMicronesia, Fed. Sts.Middle East & North AfricaMiddle East & North Africa (excluding high income)Middle East & North Africa (IDA & IBRD countries)Middle incomeMoldovaMongoliaMontenegroMoroccoMozambiqueMyanmarNamibiaNauruNepalNetherlandsNew ZealandNicaraguaNigerNigeriaNorth AmericaNorwayOECD membersOmanOther small statesPacific island small statesPakistanPalauPanamaPapua New GuineaParaguayPeruPhilippinesPolandPortugalPost-demographic dividendPre-demographic dividendPuerto RicoQatarRomaniaRussian FederationRwandaSamoaSao Tome and PrincipeSaudi ArabiaSenegalSerbiaSeychellesSierra LeoneSingaporeSlovak RepublicSloveniaSmall statesSolomon IslandsSouth AfricaSouth AsiaSouth Asia (IDA & IBRD)South SudanSpainSri LankaSt. Kitts and NevisSt. LuciaSt. Vincent and the GrenadinesSub-Saharan Africa Sub-Saharan Africa (excluding high income)Sub-Saharan Africa (IDA & IBRD countries)SudanSurinameSwazilandSwedenSwitzerlandTajikistanTanzaniaThailandTimor-LesteTogoTongaTrinidad and TobagoTunisiaTurkeyTurkmenistanTuvaluUgandaUkraineUnited Arab EmiratesUnited KingdomUnited StatesUpper middle incomeUruguayUzbekistanVanuatuVenezuela, RBVietnamWest Bank and GazaWorldYemen, Rep.ZambiaZimbabwe Timeline:
This timeline shows a graph from 1991 to 2016 of European Union. No data until 1990. Number of actual observations by date: 26.
Source name:
World Development Indicators
Source organization:
World Bank, International Comparison Program database.
Categories, topics:
Economy & Growth
Last updated:
apr 23, 2017
Indicators value changes by year
Minimum:
7.11 trl
jan 1, 1991
Maximum:
19.613 trl
jan 1, 2016
At the date of observation
Value
Absolute change
Change from previous value
jan 1, 1991
7.11 trl
+7.11 trl
0.0%
jan 1, 1992
7.458 trl
+347.371 bln
4.89%
jan 1, 1993
7.715 trl
+257.519 bln
3.45%
jan 1, 1994
7.893 trl
+178.094 bln
2.31%
jan 1, 1995
8.304 trl
+410.883 bln
5.21%
jan 1, 1996
8.642 trl
+337.499 bln
4.06%
jan 1, 1997
9.008 trl
+366.887 bln
4.25%
jan 1, 1998
9.431 trl
+422.065 bln
4.69%
jan 1, 1999
9.868 trl
+437.466 bln
4.64%
jan 1, 2000
10.283 trl
+414.784 bln
4.2%
jan 1, 2001
11.003 trl
+720.552 bln
7.01%
jan 1, 2002
11.578 trl
+574.865 bln
5.22%
jan 1, 2003
12.08 trl
+501.464 bln
4.33%
jan 1, 2004
12.431 trl
+351.676 bln
2.91%
jan 1, 2005
13.123 trl
+692.099 bln
5.57%
jan 1, 2006
13.665 trl
+541.508 bln
4.13%
jan 1, 2007
14.838 trl
+1.173 trl
8.58%
jan 1, 2008
15.719 trl
+881.047 bln
5.94%
jan 1, 2009
16.427 trl
+708.328 bln
4.51%
jan 1, 2010
16.151 trl
-276.564 bln
-1.68%
jan 1, 2011
16.8 trl
+649.527 bln
4.02%
jan 1, 2012
17.512 trl
+712.085 bln
4.24%
jan 1, 2013
17.81 trl
+297.9 bln
1.7%
jan 1, 2014
18.488 trl
+677.351 bln
3.8%
jan 1, 2015
19.034 trl
+546.386 bln
2.96%
jan 1, 2016
19.613 trl
+579.09 bln
3.04%
Ranking of countries by current statistics by years


Comments: