29
/
en
AIzaSyAYiBZKx7MnpbEhh9jyipgxe19OcubqV5w
April 1, 2024
30703
Europe & Central Asia
ECS
false
2
1
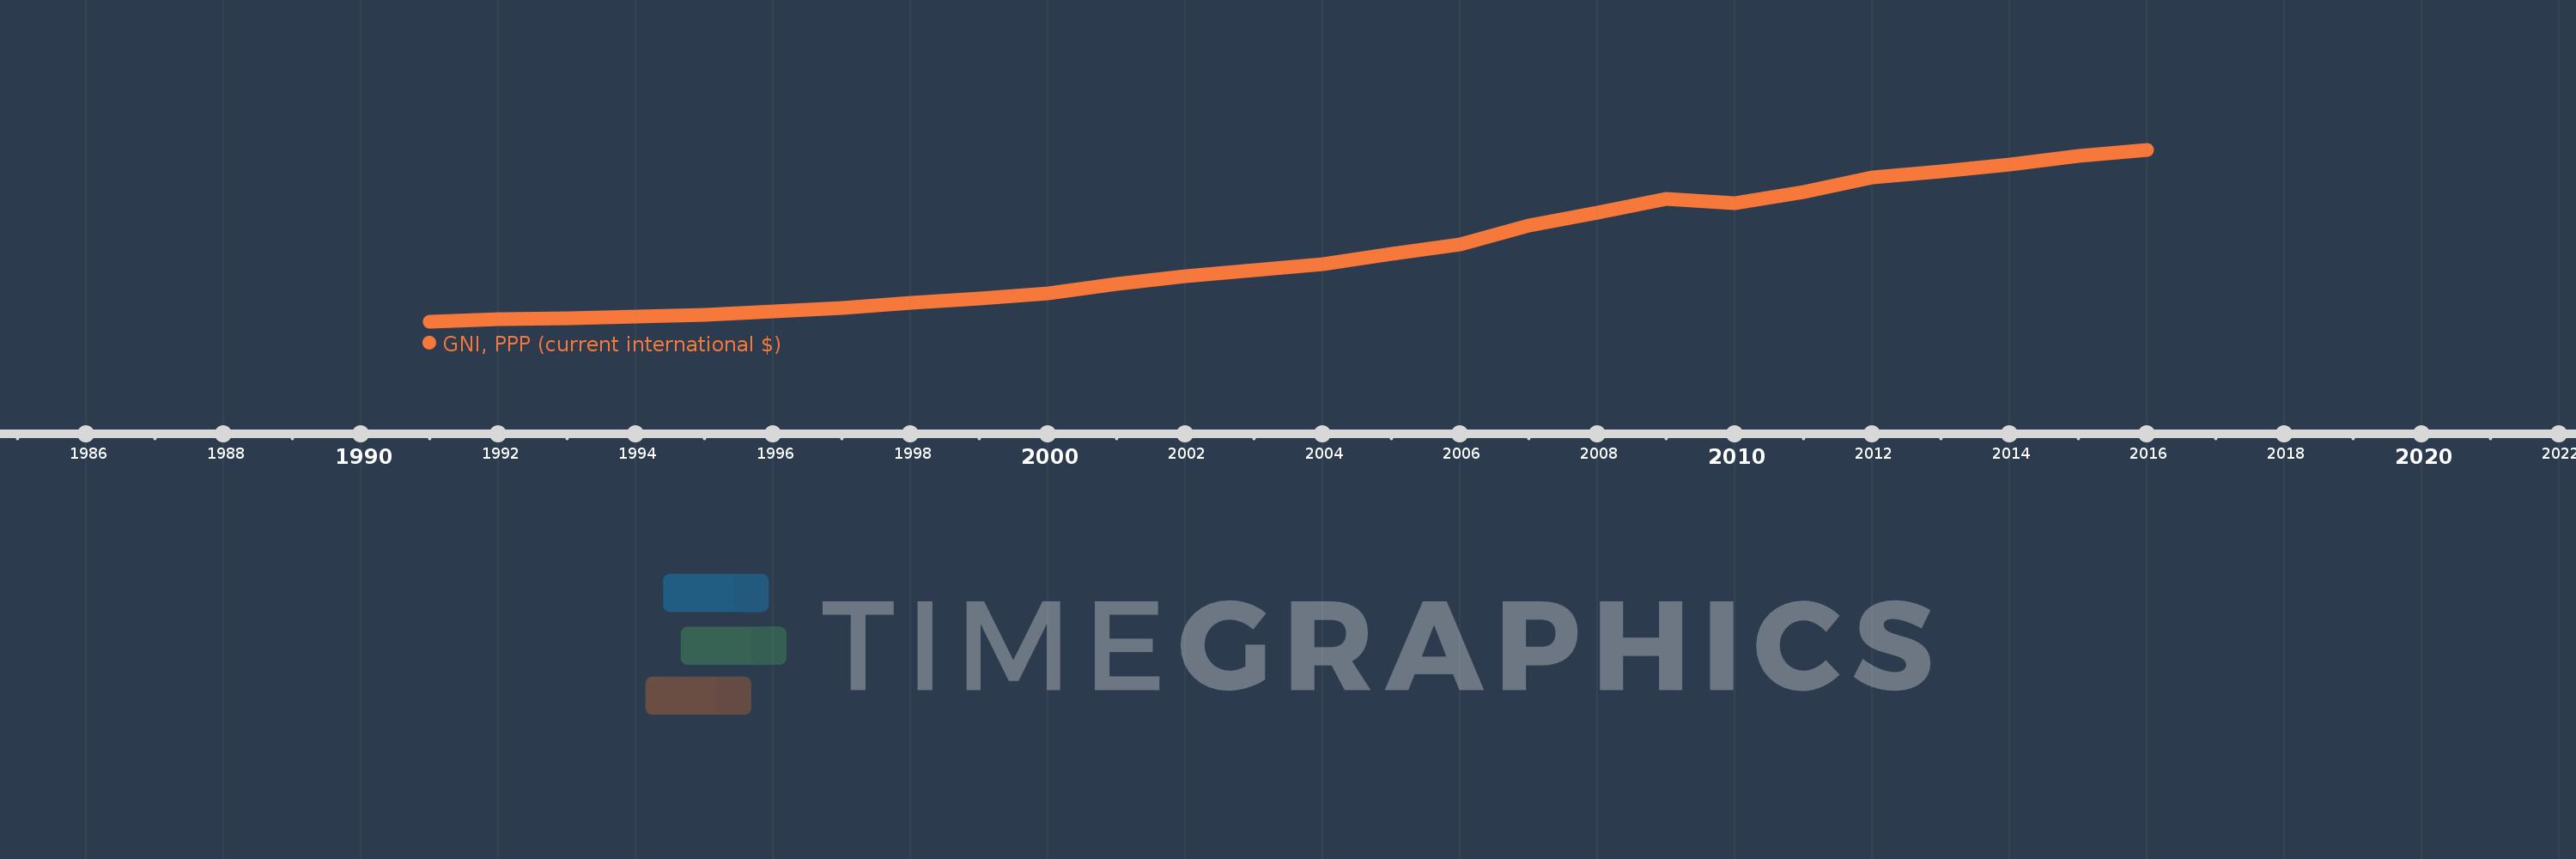
GNI, PPP (current international $)
2016,2015,2014,2013,2012,2011,2010,2009,2008,2007,2006,2005,2004,2003,2002,2001,2000,1999,1998,1997,1996,1995,1994,1993,1992,1991
This statistics in other country:
AfghanistanAlbaniaAlgeriaAngolaAntigua and BarbudaArab WorldArgentinaArmeniaAustraliaAustriaAzerbaijanBahamas, TheBahrainBangladeshBarbadosBelarusBelgiumBelizeBeninBermudaBhutanBoliviaBosnia and HerzegovinaBotswanaBrazilBrunei DarussalamBulgariaBurkina FasoBurundiCabo VerdeCambodiaCameroonCanadaCaribbean small statesCentral African RepublicCentral Europe and the BalticsChadChileChinaColombiaComorosCongo, Dem. Rep.Congo, Rep.Costa RicaCote d'IvoireCroatiaCubaCyprusCzech RepublicDenmarkDjiboutiDominicaDominican RepublicEarly-demographic dividendEast Asia & PacificEast Asia & Pacific (excluding high income)East Asia & Pacific (IDA & IBRD countries)EcuadorEgypt, Arab Rep.El SalvadorEquatorial GuineaEritreaEstoniaEthiopiaEuro areaEurope & Central AsiaEurope & Central Asia (excluding high income)Europe & Central Asia (IDA & IBRD countries)European UnionFijiFinlandFragile and conflict affected situationsFranceGabonGambia, TheGeorgiaGermanyGhanaGreeceGrenadaGuatemalaGuineaGuinea-BissauGuyanaHaitiHeavily indebted poor countries (HIPC)High incomeHondurasHong Kong SAR, ChinaHungaryIBRD onlyIcelandIDA & IBRD totalIDA blendIDA onlyIDA totalIndiaIndonesiaIran, Islamic Rep.IraqIrelandIsraelItalyJamaicaJapanJordanKazakhstanKenyaKiribatiKorea, Rep.KosovoKuwaitKyrgyz RepublicLao PDRLate-demographic dividendLatin America & Caribbean Latin America & Caribbean (excluding high income)Latin America & the Caribbean (IDA & IBRD countries)LatviaLeast developed countries: UN classificationLebanonLesothoLiberiaLibyaLithuaniaLow & middle incomeLow incomeLower middle incomeLuxembourgMacao SAR, ChinaMacedonia, FYRMadagascarMalawiMalaysiaMaldivesMaliMaltaMarshall IslandsMauritaniaMauritiusMexicoMicronesia, Fed. Sts.Middle East & North AfricaMiddle East & North Africa (excluding high income)Middle East & North Africa (IDA & IBRD countries)Middle incomeMoldovaMongoliaMontenegroMoroccoMozambiqueMyanmarNamibiaNauruNepalNetherlandsNew ZealandNicaraguaNigerNigeriaNorth AmericaNorwayOECD membersOmanOther small statesPacific island small statesPakistanPalauPanamaPapua New GuineaParaguayPeruPhilippinesPolandPortugalPost-demographic dividendPre-demographic dividendPuerto RicoQatarRomaniaRussian FederationRwandaSamoaSao Tome and PrincipeSaudi ArabiaSenegalSerbiaSeychellesSierra LeoneSingaporeSlovak RepublicSloveniaSmall statesSolomon IslandsSouth AfricaSouth AsiaSouth Asia (IDA & IBRD)South SudanSpainSri LankaSt. Kitts and NevisSt. LuciaSt. Vincent and the GrenadinesSub-Saharan Africa Sub-Saharan Africa (excluding high income)Sub-Saharan Africa (IDA & IBRD countries)SudanSurinameSwazilandSwedenSwitzerlandTajikistanTanzaniaThailandTimor-LesteTogoTongaTrinidad and TobagoTunisiaTurkeyTurkmenistanTuvaluUgandaUkraineUnited Arab EmiratesUnited KingdomUnited StatesUpper middle incomeUruguayUzbekistanVanuatuVenezuela, RBVietnamWest Bank and GazaWorldYemen, Rep.ZambiaZimbabwe Timeline:
This timeline shows a graph from 1991 to 2016 of Europe & Central Asia. No data until 1990. Number of actual observations by date: 26.
Source name:
World Development Indicators
Source organization:
World Bank, International Comparison Program database.
Categories, topics:
Economy & Growth
Last updated:
apr 23, 2017
Indicators value changes by year
Minimum:
9.653 trl
jan 1, 1991
Maximum:
27.27 trl
jan 1, 2016
At the date of observation
Value
Absolute change
Change from previous value
jan 1, 1991
9.653 trl
+9.653 trl
0.0%
jan 1, 1992
9.973 trl
+320.491 bln
3.32%
jan 1, 1993
10.054 trl
+80.481 bln
0.81%
jan 1, 1994
10.164 trl
+109.971 bln
1.09%
jan 1, 1995
10.391 trl
+226.871 bln
2.23%
jan 1, 1996
10.726 trl
+335.139 bln
3.23%
jan 1, 1997
11.131 trl
+405.172 bln
3.78%
jan 1, 1998
11.655 trl
+524.594 bln
4.71%
jan 1, 1999
12.09 trl
+434.836 bln
3.73%
jan 1, 2000
12.592 trl
+502.14 bln
4.15%
jan 1, 2001
13.598 trl
+1.006 trl
7.99%
jan 1, 2002
14.32 trl
+721.71 bln
5.31%
jan 1, 2003
14.982 trl
+662.65 bln
4.63%
jan 1, 2004
15.598 trl
+615.349 bln
4.11%
jan 1, 2005
16.654 trl
+1.057 trl
6.77%
jan 1, 2006
17.613 trl
+958.8 bln
5.76%
jan 1, 2007
19.512 trl
+1.899 trl
10.78%
jan 1, 2008
20.892 trl
+1.38 trl
7.07%
jan 1, 2009
22.29 trl
+1.398 trl
6.69%
jan 1, 2010
21.854 trl
-436.649 bln
-1.96%
jan 1, 2011
22.942 trl
+1.088 trl
4.98%
jan 1, 2012
24.434 trl
+1.493 trl
6.51%
jan 1, 2013
25.069 trl
+635.035 bln
2.6%
jan 1, 2014
25.792 trl
+722.687 bln
2.88%
jan 1, 2015
26.68 trl
+888.192 bln
3.44%
jan 1, 2016
27.27 trl
+589.607 bln
2.21%
Ranking of countries by current statistics by years


Comments: