29
/
en
AIzaSyAYiBZKx7MnpbEhh9jyipgxe19OcubqV5w
April 1, 2024
102461
Central African Republic
CAF
true
2
1
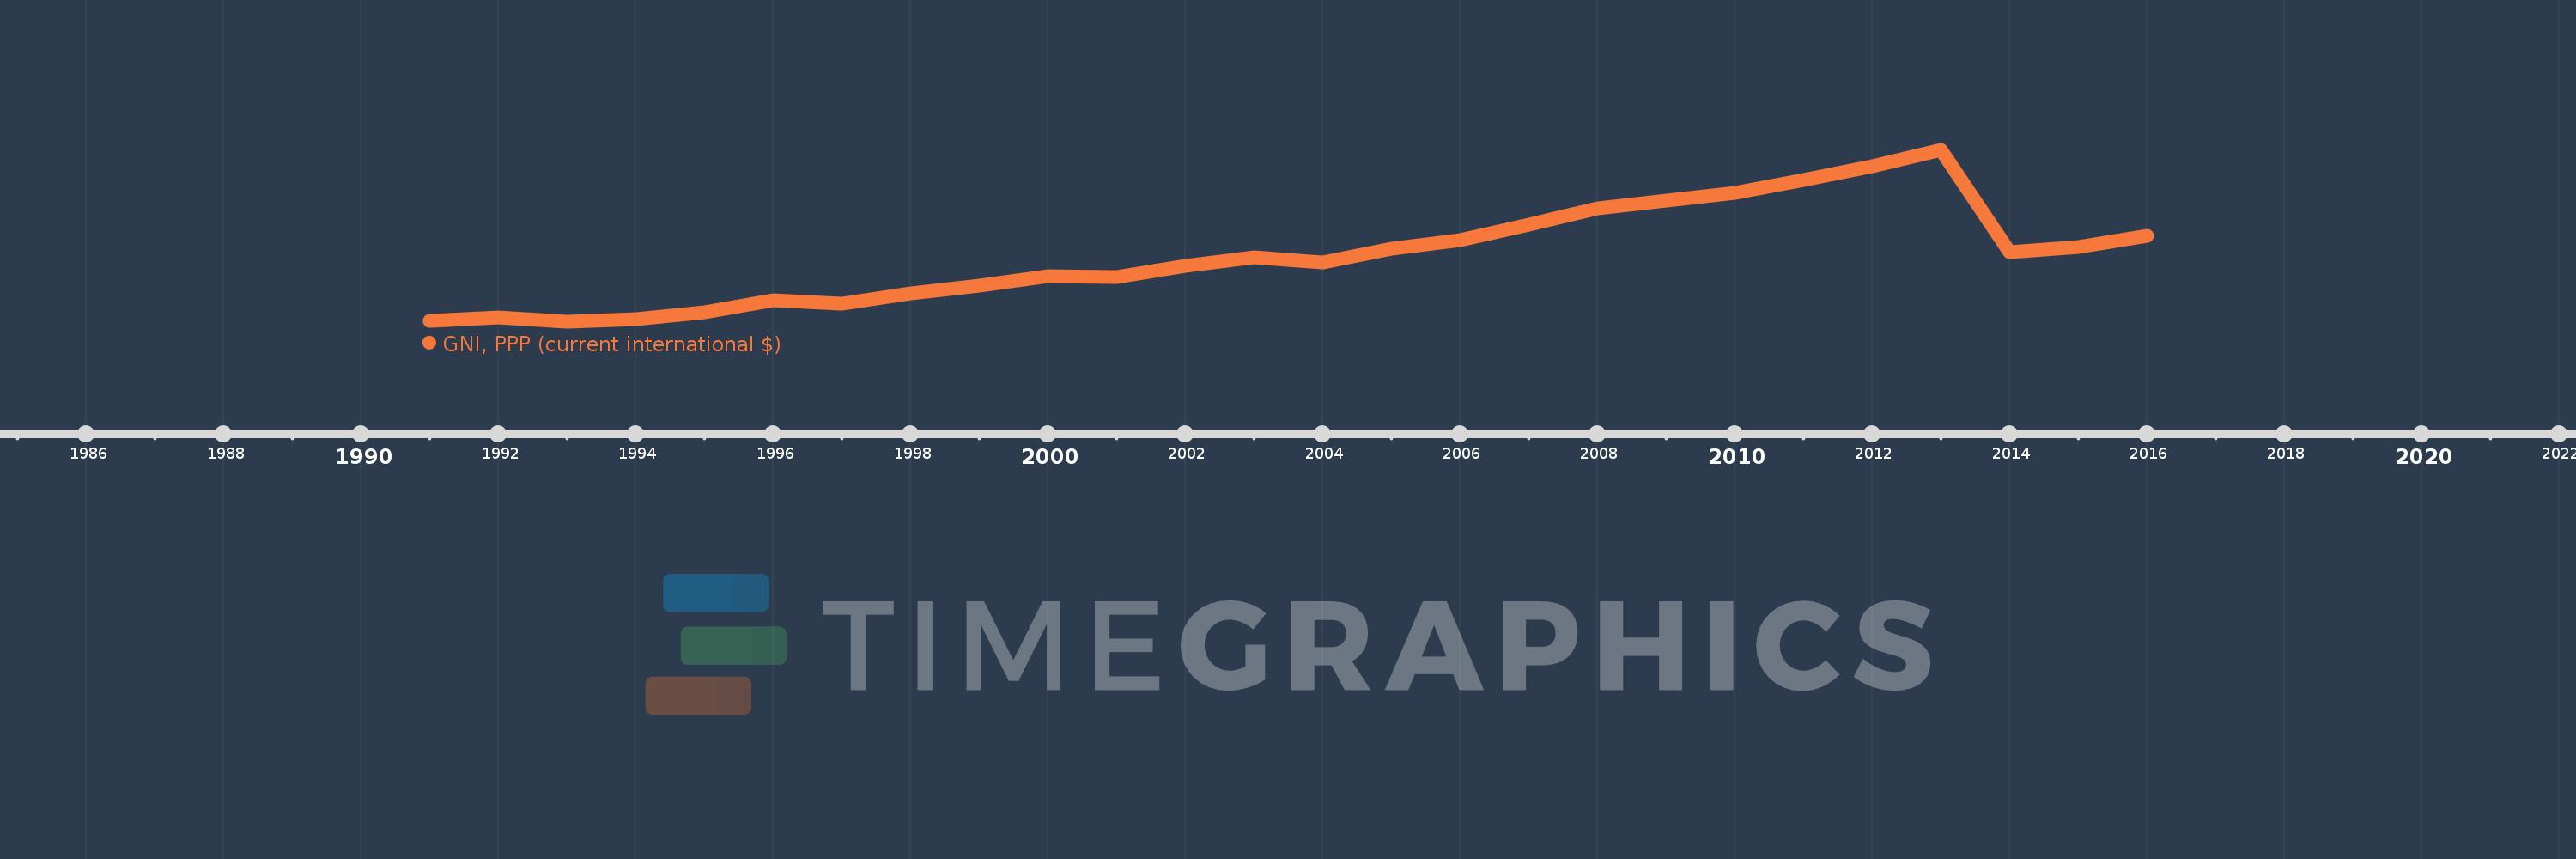
GNI, PPP (current international $)
2016,2015,2014,2013,2012,2011,2010,2009,2008,2007,2006,2005,2004,2003,2002,2001,2000,1999,1998,1997,1996,1995,1994,1993,1992,1991
This statistics in other country:
AfghanistanAlbaniaAlgeriaAngolaAntigua and BarbudaArab WorldArgentinaArmeniaAustraliaAustriaAzerbaijanBahamas, TheBahrainBangladeshBarbadosBelarusBelgiumBelizeBeninBermudaBhutanBoliviaBosnia and HerzegovinaBotswanaBrazilBrunei DarussalamBulgariaBurkina FasoBurundiCabo VerdeCambodiaCameroonCanadaCaribbean small statesCentral African RepublicCentral Europe and the BalticsChadChileChinaColombiaComorosCongo, Dem. Rep.Congo, Rep.Costa RicaCote d'IvoireCroatiaCubaCyprusCzech RepublicDenmarkDjiboutiDominicaDominican RepublicEarly-demographic dividendEast Asia & PacificEast Asia & Pacific (excluding high income)East Asia & Pacific (IDA & IBRD countries)EcuadorEgypt, Arab Rep.El SalvadorEquatorial GuineaEritreaEstoniaEthiopiaEuro areaEurope & Central AsiaEurope & Central Asia (excluding high income)Europe & Central Asia (IDA & IBRD countries)European UnionFijiFinlandFragile and conflict affected situationsFranceGabonGambia, TheGeorgiaGermanyGhanaGreeceGrenadaGuatemalaGuineaGuinea-BissauGuyanaHaitiHeavily indebted poor countries (HIPC)High incomeHondurasHong Kong SAR, ChinaHungaryIBRD onlyIcelandIDA & IBRD totalIDA blendIDA onlyIDA totalIndiaIndonesiaIran, Islamic Rep.IraqIrelandIsraelItalyJamaicaJapanJordanKazakhstanKenyaKiribatiKorea, Rep.KosovoKuwaitKyrgyz RepublicLao PDRLate-demographic dividendLatin America & Caribbean Latin America & Caribbean (excluding high income)Latin America & the Caribbean (IDA & IBRD countries)LatviaLeast developed countries: UN classificationLebanonLesothoLiberiaLibyaLithuaniaLow & middle incomeLow incomeLower middle incomeLuxembourgMacao SAR, ChinaMacedonia, FYRMadagascarMalawiMalaysiaMaldivesMaliMaltaMarshall IslandsMauritaniaMauritiusMexicoMicronesia, Fed. Sts.Middle East & North AfricaMiddle East & North Africa (excluding high income)Middle East & North Africa (IDA & IBRD countries)Middle incomeMoldovaMongoliaMontenegroMoroccoMozambiqueMyanmarNamibiaNauruNepalNetherlandsNew ZealandNicaraguaNigerNigeriaNorth AmericaNorwayOECD membersOmanOther small statesPacific island small statesPakistanPalauPanamaPapua New GuineaParaguayPeruPhilippinesPolandPortugalPost-demographic dividendPre-demographic dividendPuerto RicoQatarRomaniaRussian FederationRwandaSamoaSao Tome and PrincipeSaudi ArabiaSenegalSerbiaSeychellesSierra LeoneSingaporeSlovak RepublicSloveniaSmall statesSolomon IslandsSouth AfricaSouth AsiaSouth Asia (IDA & IBRD)South SudanSpainSri LankaSt. Kitts and NevisSt. LuciaSt. Vincent and the GrenadinesSub-Saharan Africa Sub-Saharan Africa (excluding high income)Sub-Saharan Africa (IDA & IBRD countries)SudanSurinameSwazilandSwedenSwitzerlandTajikistanTanzaniaThailandTimor-LesteTogoTongaTrinidad and TobagoTunisiaTurkeyTurkmenistanTuvaluUgandaUkraineUnited Arab EmiratesUnited KingdomUnited StatesUpper middle incomeUruguayUzbekistanVanuatuVenezuela, RBVietnamWest Bank and GazaWorldYemen, Rep.ZambiaZimbabwe Timeline:
This timeline shows a graph from 1991 to 2016 of Central African Republic. No data until 1990. Number of actual observations by date: 26.
Source name:
World Development Indicators
Source organization:
World Bank, International Comparison Program database.
Categories, topics:
Economy & Growth
Last updated:
apr 23, 2017
Indicators value changes by year
Minimum:
1.723 bln
jan 1, 1993
Maximum:
4.349 bln
jan 1, 2013
At the date of observation
Value
Absolute change
Change from previous value
jan 1, 1991
1.744 bln
+1.744 bln
0.0%
jan 1, 1992
1.799 bln
+55.134 mln
3.16%
jan 1, 1993
1.723 bln
-75.916 mln
-4.22%
jan 1, 1994
1.763 bln
+40.348 mln
2.34%
jan 1, 1995
1.87 bln
+106.988 mln
6.07%
jan 1, 1996
2.059 bln
+188.248 mln
10.06%
jan 1, 1997
2.008 bln
-50.555 mln
-2.46%
jan 1, 1998
2.16 bln
+151.689 mln
7.55%
jan 1, 1999
2.28 bln
+120.052 mln
5.56%
jan 1, 2000
2.425 bln
+145.64 mln
6.39%
jan 1, 2001
2.404 bln
-21.531 mln
-0.89%
jan 1, 2002
2.584 bln
+179.902 mln
7.48%
jan 1, 2003
2.716 bln
+132.453 mln
5.13%
jan 1, 2004
2.639 bln
-77.616 mln
-2.86%
jan 1, 2005
2.849 bln
+210.798 mln
7.99%
jan 1, 2006
2.978 bln
+128.318 mln
4.5%
jan 1, 2007
3.215 bln
+236.996 mln
7.96%
jan 1, 2008
3.457 bln
+241.886 mln
7.52%
jan 1, 2009
3.579 bln
+122.469 mln
3.54%
jan 1, 2010
3.7 bln
+120.681 mln
3.37%
jan 1, 2011
3.889 bln
+189.432 mln
5.12%
jan 1, 2012
4.099 bln
+209.439 mln
5.39%
jan 1, 2013
4.349 bln
+250.405 mln
6.11%
jan 1, 2014
2.793 bln
-1.556 bln
-35.77%
jan 1, 2015
2.874 bln
+81.095 mln
2.9%
jan 1, 2016
3.045 bln
+170.947 mln
5.95%
Ranking of countries by current statistics by years


Comments: