29
/
en
AIzaSyAYiBZKx7MnpbEhh9jyipgxe19OcubqV5w
April 1, 2024
212991
Nigeria
NGA
true
2
1
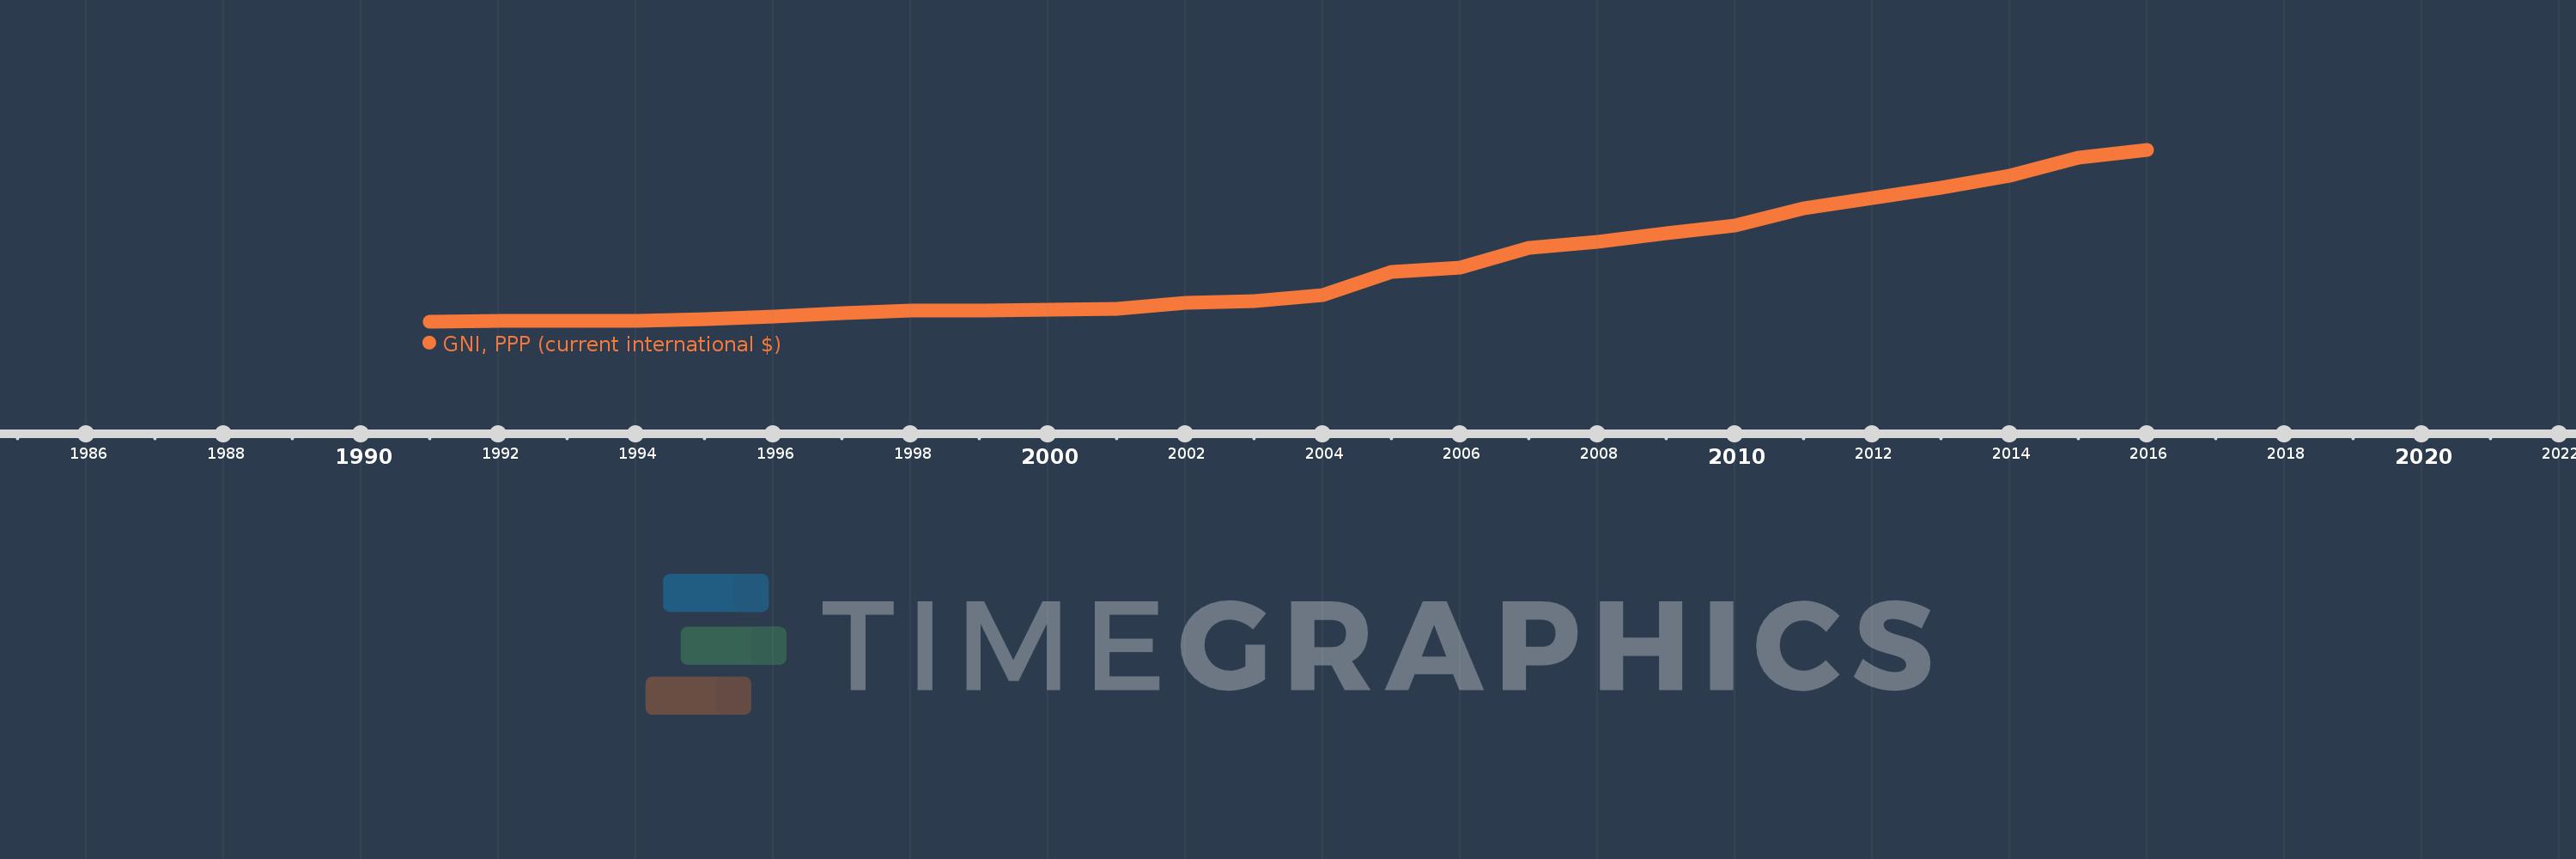
GNI, PPP (current international $)
2016,2015,2014,2013,2012,2011,2010,2009,2008,2007,2006,2005,2004,2003,2002,2001,1999,1998,1997,1996,1995,1994,1993,1992,1991
This statistics in other country:
AfghanistanAlbaniaAlgeriaAngolaAntigua and BarbudaArab WorldArgentinaArmeniaAustraliaAustriaAzerbaijanBahamas, TheBahrainBangladeshBarbadosBelarusBelgiumBelizeBeninBermudaBhutanBoliviaBosnia and HerzegovinaBotswanaBrazilBrunei DarussalamBulgariaBurkina FasoBurundiCabo VerdeCambodiaCameroonCanadaCaribbean small statesCentral African RepublicCentral Europe and the BalticsChadChileChinaColombiaComorosCongo, Dem. Rep.Congo, Rep.Costa RicaCote d'IvoireCroatiaCubaCyprusCzech RepublicDenmarkDjiboutiDominicaDominican RepublicEarly-demographic dividendEast Asia & PacificEast Asia & Pacific (excluding high income)East Asia & Pacific (IDA & IBRD countries)EcuadorEgypt, Arab Rep.El SalvadorEquatorial GuineaEritreaEstoniaEthiopiaEuro areaEurope & Central AsiaEurope & Central Asia (excluding high income)Europe & Central Asia (IDA & IBRD countries)European UnionFijiFinlandFragile and conflict affected situationsFranceGabonGambia, TheGeorgiaGermanyGhanaGreeceGrenadaGuatemalaGuineaGuinea-BissauGuyanaHaitiHeavily indebted poor countries (HIPC)High incomeHondurasHong Kong SAR, ChinaHungaryIBRD onlyIcelandIDA & IBRD totalIDA blendIDA onlyIDA totalIndiaIndonesiaIran, Islamic Rep.IraqIrelandIsraelItalyJamaicaJapanJordanKazakhstanKenyaKiribatiKorea, Rep.KosovoKuwaitKyrgyz RepublicLao PDRLate-demographic dividendLatin America & Caribbean Latin America & Caribbean (excluding high income)Latin America & the Caribbean (IDA & IBRD countries)LatviaLeast developed countries: UN classificationLebanonLesothoLiberiaLibyaLithuaniaLow & middle incomeLow incomeLower middle incomeLuxembourgMacao SAR, ChinaMacedonia, FYRMadagascarMalawiMalaysiaMaldivesMaliMaltaMarshall IslandsMauritaniaMauritiusMexicoMicronesia, Fed. Sts.Middle East & North AfricaMiddle East & North Africa (excluding high income)Middle East & North Africa (IDA & IBRD countries)Middle incomeMoldovaMongoliaMontenegroMoroccoMozambiqueMyanmarNamibiaNauruNepalNetherlandsNew ZealandNicaraguaNigerNigeriaNorth AmericaNorwayOECD membersOmanOther small statesPacific island small statesPakistanPalauPanamaPapua New GuineaParaguayPeruPhilippinesPolandPortugalPost-demographic dividendPre-demographic dividendPuerto RicoQatarRomaniaRussian FederationRwandaSamoaSao Tome and PrincipeSaudi ArabiaSenegalSerbiaSeychellesSierra LeoneSingaporeSlovak RepublicSloveniaSmall statesSolomon IslandsSouth AfricaSouth AsiaSouth Asia (IDA & IBRD)South SudanSpainSri LankaSt. Kitts and NevisSt. LuciaSt. Vincent and the GrenadinesSub-Saharan Africa Sub-Saharan Africa (excluding high income)Sub-Saharan Africa (IDA & IBRD countries)SudanSurinameSwazilandSwedenSwitzerlandTajikistanTanzaniaThailandTimor-LesteTogoTongaTrinidad and TobagoTunisiaTurkeyTurkmenistanTuvaluUgandaUkraineUnited Arab EmiratesUnited KingdomUnited StatesUpper middle incomeUruguayUzbekistanVanuatuVenezuela, RBVietnamWest Bank and GazaWorldYemen, Rep.ZambiaZimbabwe Timeline:
This timeline shows a graph from 1991 to 2016 of Nigeria. No data until 1990. Number of actual observations by date: 25.
Source name:
World Development Indicators
Source organization:
World Bank, International Comparison Program database.
Categories, topics:
Economy & Growth
Last updated:
apr 23, 2017
Indicators value changes by year
Minimum:
169.702 bln
jan 1, 1991
Maximum:
1.058 trl
jan 1, 2016
At the date of observation
Value
Absolute change
Change from previous value
jan 1, 1991
169.702 bln
+169.702 bln
0.0%
jan 1, 1992
175.078 bln
+5.376 bln
3.17%
jan 1, 1993
177.673 bln
+2.595 bln
1.48%
jan 1, 1994
175.803 bln
-1.87 bln
-1.05%
jan 1, 1995
185.113 bln
+9.311 bln
5.3%
jan 1, 1996
199.725 bln
+14.612 bln
7.89%
jan 1, 1997
216.775 bln
+17.05 bln
8.54%
jan 1, 1998
226.987 bln
+10.212 bln
4.71%
jan 1, 1999
229.173 bln
+2.186 bln
0.96%
jan 1, 2001
239.603 bln
+10.43 bln
4.55%
jan 1, 2002
267.601 bln
+27.998 bln
11.69%
jan 1, 2003
278.772 bln
+11.171 bln
4.17%
jan 1, 2004
310.247 bln
+31.475 bln
11.29%
jan 1, 2005
426.799 bln
+116.552 bln
37.57%
jan 1, 2006
452.182 bln
+25.383 bln
5.95%
jan 1, 2007
554.245 bln
+102.063 bln
22.57%
jan 1, 2008
583.199 bln
+28.954 bln
5.22%
jan 1, 2009
630.8 bln
+47.6 bln
8.16%
jan 1, 2010
670.069 bln
+39.269 bln
6.23%
jan 1, 2011
757.682 bln
+87.614 bln
13.08%
jan 1, 2012
809.101 bln
+51.419 bln
6.79%
jan 1, 2013
865.788 bln
+56.687 bln
7.01%
jan 1, 2014
925.611 bln
+59.822 bln
6.91%
jan 1, 2015
1.019 trl
+93.154 bln
10.06%
jan 1, 2016
1.058 trl
+39.713 bln
3.9%
Ranking of countries by current statistics by years


Comments: