29
/
en
AIzaSyAYiBZKx7MnpbEhh9jyipgxe19OcubqV5w
April 1, 2024
39010
IDA only
IDX
false
2
1
GNI, PPP (current international $)
2016,2015,2014,2013,2012,2011,2010,2009,2008,2007,2006,2005,2004,2003,2002,2001,2000,1999,1998,1997,1996,1995,1994,1993,1992,1991
This statistics in other country:
AfghanistanAlbaniaAlgeriaAngolaAntigua and BarbudaArab WorldArgentinaArmeniaAustraliaAustriaAzerbaijanBahamas, TheBahrainBangladeshBarbadosBelarusBelgiumBelizeBeninBermudaBhutanBoliviaBosnia and HerzegovinaBotswanaBrazilBrunei DarussalamBulgariaBurkina FasoBurundiCabo VerdeCambodiaCameroonCanadaCaribbean small statesCentral African RepublicCentral Europe and the BalticsChadChileChinaColombiaComorosCongo, Dem. Rep.Congo, Rep.Costa RicaCote d'IvoireCroatiaCubaCyprusCzech RepublicDenmarkDjiboutiDominicaDominican RepublicEarly-demographic dividendEast Asia & PacificEast Asia & Pacific (excluding high income)East Asia & Pacific (IDA & IBRD countries)EcuadorEgypt, Arab Rep.El SalvadorEquatorial GuineaEritreaEstoniaEthiopiaEuro areaEurope & Central AsiaEurope & Central Asia (excluding high income)Europe & Central Asia (IDA & IBRD countries)European UnionFijiFinlandFragile and conflict affected situationsFranceGabonGambia, TheGeorgiaGermanyGhanaGreeceGrenadaGuatemalaGuineaGuinea-BissauGuyanaHaitiHeavily indebted poor countries (HIPC)High incomeHondurasHong Kong SAR, ChinaHungaryIBRD onlyIcelandIDA & IBRD totalIDA blendIDA onlyIDA totalIndiaIndonesiaIran, Islamic Rep.IraqIrelandIsraelItalyJamaicaJapanJordanKazakhstanKenyaKiribatiKorea, Rep.KosovoKuwaitKyrgyz RepublicLao PDRLate-demographic dividendLatin America & Caribbean Latin America & Caribbean (excluding high income)Latin America & the Caribbean (IDA & IBRD countries)LatviaLeast developed countries: UN classificationLebanonLesothoLiberiaLibyaLithuaniaLow & middle incomeLow incomeLower middle incomeLuxembourgMacao SAR, ChinaMacedonia, FYRMadagascarMalawiMalaysiaMaldivesMaliMaltaMarshall IslandsMauritaniaMauritiusMexicoMicronesia, Fed. Sts.Middle East & North AfricaMiddle East & North Africa (excluding high income)Middle East & North Africa (IDA & IBRD countries)Middle incomeMoldovaMongoliaMontenegroMoroccoMozambiqueMyanmarNamibiaNauruNepalNetherlandsNew ZealandNicaraguaNigerNigeriaNorth AmericaNorwayOECD membersOmanOther small statesPacific island small statesPakistanPalauPanamaPapua New GuineaParaguayPeruPhilippinesPolandPortugalPost-demographic dividendPre-demographic dividendPuerto RicoQatarRomaniaRussian FederationRwandaSamoaSao Tome and PrincipeSaudi ArabiaSenegalSerbiaSeychellesSierra LeoneSingaporeSlovak RepublicSloveniaSmall statesSolomon IslandsSouth AfricaSouth AsiaSouth Asia (IDA & IBRD)South SudanSpainSri LankaSt. Kitts and NevisSt. LuciaSt. Vincent and the GrenadinesSub-Saharan Africa Sub-Saharan Africa (excluding high income)Sub-Saharan Africa (IDA & IBRD countries)SudanSurinameSwazilandSwedenSwitzerlandTajikistanTanzaniaThailandTimor-LesteTogoTongaTrinidad and TobagoTunisiaTurkeyTurkmenistanTuvaluUgandaUkraineUnited Arab EmiratesUnited KingdomUnited StatesUpper middle incomeUruguayUzbekistanVanuatuVenezuela, RBVietnamWest Bank and GazaWorldYemen, Rep.ZambiaZimbabwe Timeline:
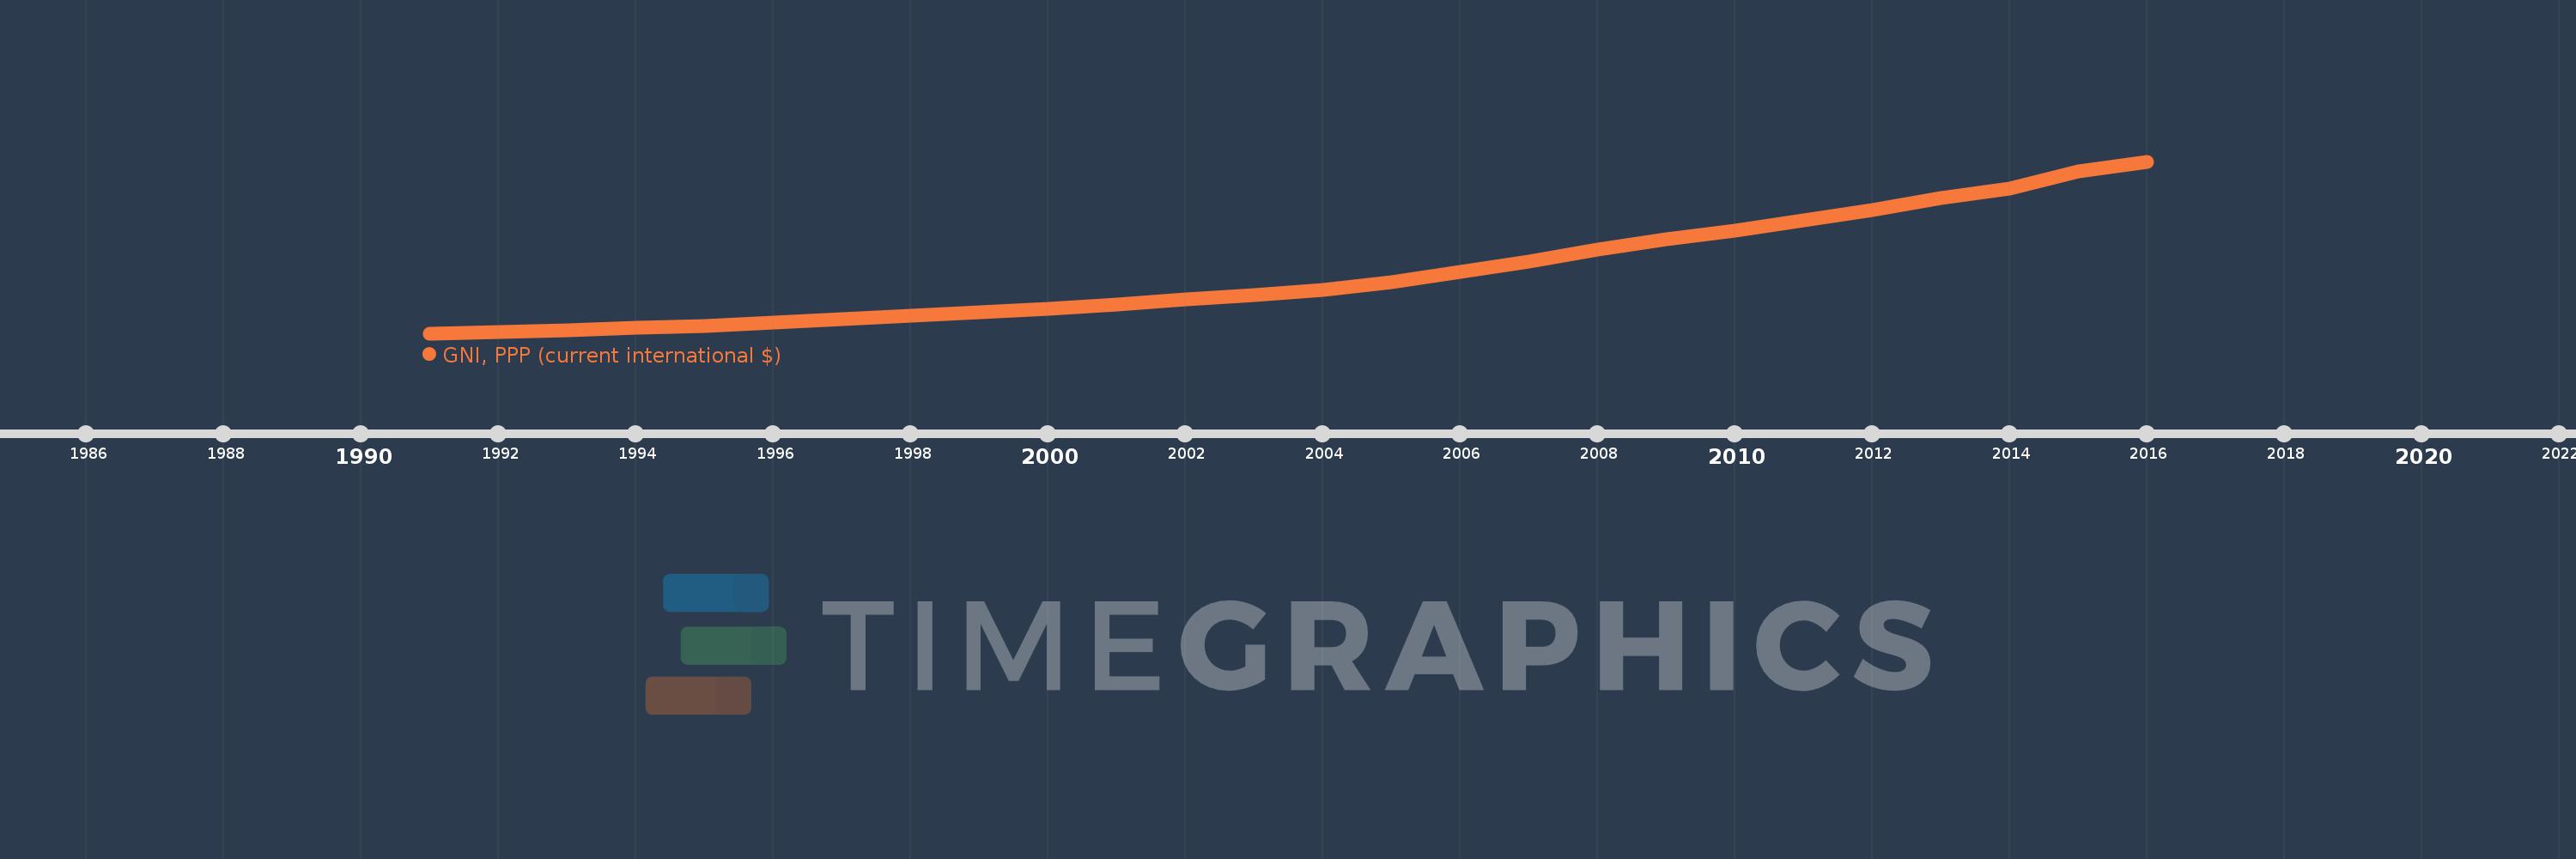
This timeline shows a graph from 1991 to 2016 of IDA only. No data until 1990. Number of actual observations by date: 26.
Source name:
World Development Indicators
Source organization:
World Bank, International Comparison Program database.
Categories, topics:
Economy & Growth
Last updated:
apr 23, 2017
Indicators value changes by year
Minimum:
550.457 bln
jan 1, 1991
Maximum:
2.893 trl
jan 1, 2016
At the date of observation
Value
Absolute change
Change from previous value
jan 1, 1991
550.457 bln
+550.457 bln
0.0%
jan 1, 1992
573.13 bln
+22.673 bln
4.12%
jan 1, 1993
592.493 bln
+19.363 bln
3.38%
jan 1, 1994
622.532 bln
+30.039 bln
5.07%
jan 1, 1995
649.929 bln
+27.397 bln
4.4%
jan 1, 1996
695.111 bln
+45.183 bln
6.95%
jan 1, 1997
748.106 bln
+52.995 bln
7.62%
jan 1, 1998
796.356 bln
+48.249 bln
6.45%
jan 1, 1999
839.997 bln
+43.641 bln
5.48%
jan 1, 2000
886.313 bln
+46.316 bln
5.51%
jan 1, 2001
944.152 bln
+57.839 bln
6.53%
jan 1, 2002
1.012 trl
+67.439 bln
7.14%
jan 1, 2003
1.069 trl
+57.562 bln
5.69%
jan 1, 2004
1.145 trl
+75.5 bln
7.06%
jan 1, 2005
1.248 trl
+103.737 bln
9.06%
jan 1, 2006
1.383 trl
+134.662 bln
10.79%
jan 1, 2007
1.531 trl
+147.904 bln
10.69%
jan 1, 2008
1.691 trl
+159.573 bln
10.42%
jan 1, 2009
1.832 trl
+141.727 bln
8.38%
jan 1, 2010
1.948 trl
+116.004 bln
6.33%
jan 1, 2011
2.092 trl
+144.188 bln
7.4%
jan 1, 2012
2.234 trl
+141.763 bln
6.77%
jan 1, 2013
2.396 trl
+161.329 bln
7.22%
jan 1, 2014
2.527 trl
+131.801 bln
5.5%
jan 1, 2015
2.753 trl
+226.003 bln
8.94%
jan 1, 2016
2.893 trl
+139.993 bln
5.08%
Ranking of countries by current statistics by years


Comments: