29
/
en
AIzaSyAYiBZKx7MnpbEhh9jyipgxe19OcubqV5w
April 1, 2024
120964
Dominica
DMA
true
2
1
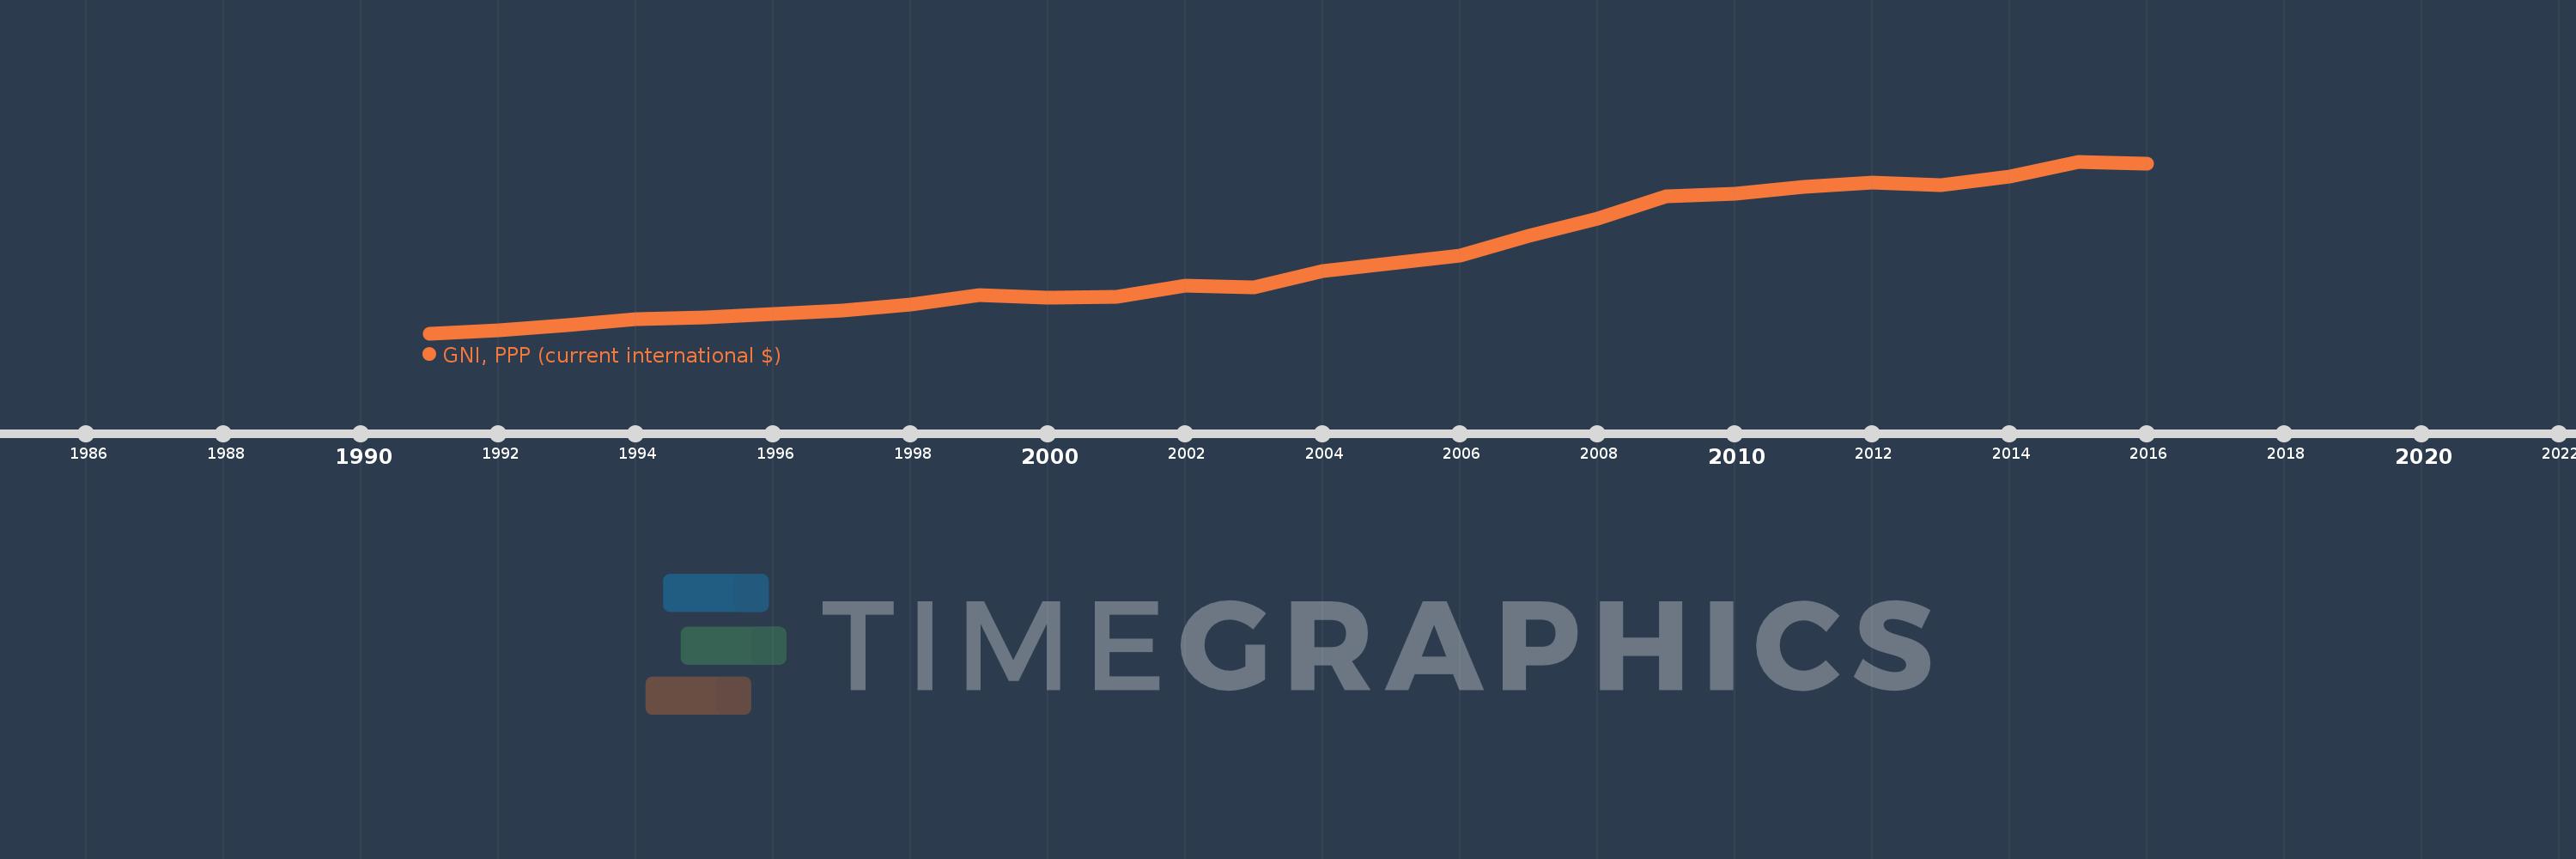
GNI, PPP (current international $)
2016,2015,2014,2013,2012,2011,2010,2009,2008,2007,2006,2005,2004,2003,2002,2001,2000,1999,1998,1997,1996,1995,1994,1993,1992,1991
This statistics in other country:
AfghanistanAlbaniaAlgeriaAngolaAntigua and BarbudaArab WorldArgentinaArmeniaAustraliaAustriaAzerbaijanBahamas, TheBahrainBangladeshBarbadosBelarusBelgiumBelizeBeninBermudaBhutanBoliviaBosnia and HerzegovinaBotswanaBrazilBrunei DarussalamBulgariaBurkina FasoBurundiCabo VerdeCambodiaCameroonCanadaCaribbean small statesCentral African RepublicCentral Europe and the BalticsChadChileChinaColombiaComorosCongo, Dem. Rep.Congo, Rep.Costa RicaCote d'IvoireCroatiaCubaCyprusCzech RepublicDenmarkDjiboutiDominicaDominican RepublicEarly-demographic dividendEast Asia & PacificEast Asia & Pacific (excluding high income)East Asia & Pacific (IDA & IBRD countries)EcuadorEgypt, Arab Rep.El SalvadorEquatorial GuineaEritreaEstoniaEthiopiaEuro areaEurope & Central AsiaEurope & Central Asia (excluding high income)Europe & Central Asia (IDA & IBRD countries)European UnionFijiFinlandFragile and conflict affected situationsFranceGabonGambia, TheGeorgiaGermanyGhanaGreeceGrenadaGuatemalaGuineaGuinea-BissauGuyanaHaitiHeavily indebted poor countries (HIPC)High incomeHondurasHong Kong SAR, ChinaHungaryIBRD onlyIcelandIDA & IBRD totalIDA blendIDA onlyIDA totalIndiaIndonesiaIran, Islamic Rep.IraqIrelandIsraelItalyJamaicaJapanJordanKazakhstanKenyaKiribatiKorea, Rep.KosovoKuwaitKyrgyz RepublicLao PDRLate-demographic dividendLatin America & Caribbean Latin America & Caribbean (excluding high income)Latin America & the Caribbean (IDA & IBRD countries)LatviaLeast developed countries: UN classificationLebanonLesothoLiberiaLibyaLithuaniaLow & middle incomeLow incomeLower middle incomeLuxembourgMacao SAR, ChinaMacedonia, FYRMadagascarMalawiMalaysiaMaldivesMaliMaltaMarshall IslandsMauritaniaMauritiusMexicoMicronesia, Fed. Sts.Middle East & North AfricaMiddle East & North Africa (excluding high income)Middle East & North Africa (IDA & IBRD countries)Middle incomeMoldovaMongoliaMontenegroMoroccoMozambiqueMyanmarNamibiaNauruNepalNetherlandsNew ZealandNicaraguaNigerNigeriaNorth AmericaNorwayOECD membersOmanOther small statesPacific island small statesPakistanPalauPanamaPapua New GuineaParaguayPeruPhilippinesPolandPortugalPost-demographic dividendPre-demographic dividendPuerto RicoQatarRomaniaRussian FederationRwandaSamoaSao Tome and PrincipeSaudi ArabiaSenegalSerbiaSeychellesSierra LeoneSingaporeSlovak RepublicSloveniaSmall statesSolomon IslandsSouth AfricaSouth AsiaSouth Asia (IDA & IBRD)South SudanSpainSri LankaSt. Kitts and NevisSt. LuciaSt. Vincent and the GrenadinesSub-Saharan Africa Sub-Saharan Africa (excluding high income)Sub-Saharan Africa (IDA & IBRD countries)SudanSurinameSwazilandSwedenSwitzerlandTajikistanTanzaniaThailandTimor-LesteTogoTongaTrinidad and TobagoTunisiaTurkeyTurkmenistanTuvaluUgandaUkraineUnited Arab EmiratesUnited KingdomUnited StatesUpper middle incomeUruguayUzbekistanVanuatuVenezuela, RBVietnamWest Bank and GazaWorldYemen, Rep.ZambiaZimbabwe Timeline:
This timeline shows a graph from 1991 to 2016 of Dominica. No data until 1990. Number of actual observations by date: 26.
Source name:
World Development Indicators
Source organization:
World Bank, International Comparison Program database.
Categories, topics:
Economy & Growth
Last updated:
apr 23, 2017
Indicators value changes by year
Minimum:
299.33 mln
jan 1, 1991
Maximum:
769.423 mln
jan 1, 2015
At the date of observation
Value
Absolute change
Change from previous value
jan 1, 1991
299.33 mln
+299.33 mln
0.0%
jan 1, 1992
307.08 mln
+7.75 mln
2.59%
jan 1, 1993
321.88 mln
+14.8 mln
4.82%
jan 1, 1994
337.375 mln
+15.495 mln
4.81%
jan 1, 1995
342.494 mln
+5.119 mln
1.52%
jan 1, 1996
353.364 mln
+10.87 mln
3.17%
jan 1, 1997
361.586 mln
+8.222 mln
2.33%
jan 1, 1998
377.539 mln
+15.954 mln
4.41%
jan 1, 1999
404.491 mln
+26.952 mln
7.14%
jan 1, 2000
397.82 mln
-6.671 mln
-1.65%
jan 1, 2001
398.618 mln
+798.005K
0.2%
jan 1, 2002
429.998 mln
+31.38 mln
7.87%
jan 1, 2003
424.531 mln
-5.467 mln
-1.27%
jan 1, 2004
469.098 mln
+44.567 mln
10.5%
jan 1, 2005
491.314 mln
+22.215 mln
4.74%
jan 1, 2006
512.76 mln
+21.447 mln
4.37%
jan 1, 2007
567.159 mln
+54.399 mln
10.61%
jan 1, 2008
614.031 mln
+46.871 mln
8.26%
jan 1, 2009
675.251 mln
+61.22 mln
9.97%
jan 1, 2010
680.896 mln
+5.645 mln
0.84%
jan 1, 2011
700.128 mln
+19.232 mln
2.82%
jan 1, 2012
711.525 mln
+11.397 mln
1.63%
jan 1, 2013
704.785 mln
-6.741 mln
-0.95%
jan 1, 2014
729.199 mln
+24.414 mln
3.46%
jan 1, 2015
769.423 mln
+40.225 mln
5.52%
jan 1, 2016
763.024 mln
-6.399 mln
-0.83%
Ranking of countries by current statistics by years


Comments: