29
/
en
AIzaSyAYiBZKx7MnpbEhh9jyipgxe19OcubqV5w
April 1, 2024
135556
Gabon
GAB
true
2
1
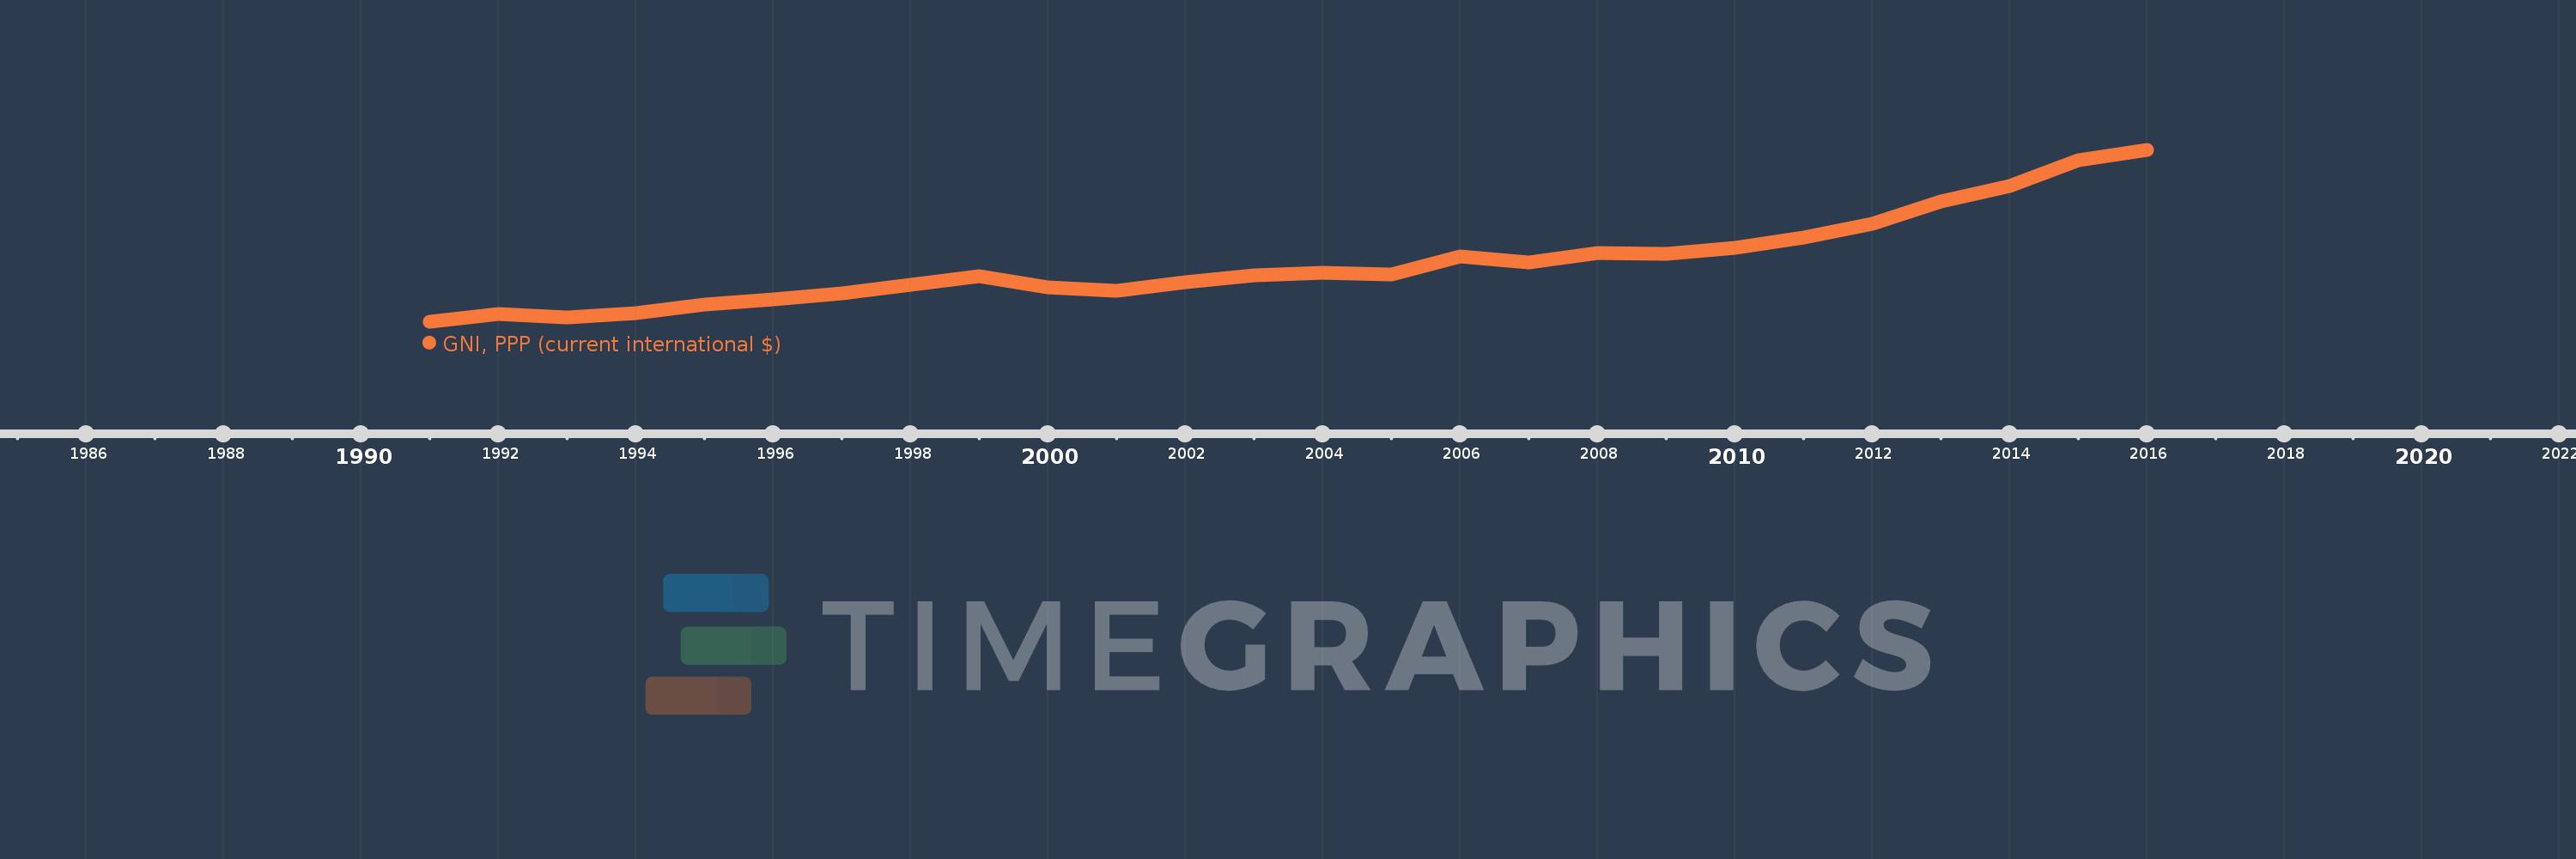
GNI, PPP (current international $)
2016,2015,2014,2013,2012,2011,2010,2009,2008,2007,2006,2005,2004,2003,2002,2001,2000,1999,1998,1997,1996,1995,1994,1993,1992,1991
This statistics in other country:
AfghanistanAlbaniaAlgeriaAngolaAntigua and BarbudaArab WorldArgentinaArmeniaAustraliaAustriaAzerbaijanBahamas, TheBahrainBangladeshBarbadosBelarusBelgiumBelizeBeninBermudaBhutanBoliviaBosnia and HerzegovinaBotswanaBrazilBrunei DarussalamBulgariaBurkina FasoBurundiCabo VerdeCambodiaCameroonCanadaCaribbean small statesCentral African RepublicCentral Europe and the BalticsChadChileChinaColombiaComorosCongo, Dem. Rep.Congo, Rep.Costa RicaCote d'IvoireCroatiaCubaCyprusCzech RepublicDenmarkDjiboutiDominicaDominican RepublicEarly-demographic dividendEast Asia & PacificEast Asia & Pacific (excluding high income)East Asia & Pacific (IDA & IBRD countries)EcuadorEgypt, Arab Rep.El SalvadorEquatorial GuineaEritreaEstoniaEthiopiaEuro areaEurope & Central AsiaEurope & Central Asia (excluding high income)Europe & Central Asia (IDA & IBRD countries)European UnionFijiFinlandFragile and conflict affected situationsFranceGabonGambia, TheGeorgiaGermanyGhanaGreeceGrenadaGuatemalaGuineaGuinea-BissauGuyanaHaitiHeavily indebted poor countries (HIPC)High incomeHondurasHong Kong SAR, ChinaHungaryIBRD onlyIcelandIDA & IBRD totalIDA blendIDA onlyIDA totalIndiaIndonesiaIran, Islamic Rep.IraqIrelandIsraelItalyJamaicaJapanJordanKazakhstanKenyaKiribatiKorea, Rep.KosovoKuwaitKyrgyz RepublicLao PDRLate-demographic dividendLatin America & Caribbean Latin America & Caribbean (excluding high income)Latin America & the Caribbean (IDA & IBRD countries)LatviaLeast developed countries: UN classificationLebanonLesothoLiberiaLibyaLithuaniaLow & middle incomeLow incomeLower middle incomeLuxembourgMacao SAR, ChinaMacedonia, FYRMadagascarMalawiMalaysiaMaldivesMaliMaltaMarshall IslandsMauritaniaMauritiusMexicoMicronesia, Fed. Sts.Middle East & North AfricaMiddle East & North Africa (excluding high income)Middle East & North Africa (IDA & IBRD countries)Middle incomeMoldovaMongoliaMontenegroMoroccoMozambiqueMyanmarNamibiaNauruNepalNetherlandsNew ZealandNicaraguaNigerNigeriaNorth AmericaNorwayOECD membersOmanOther small statesPacific island small statesPakistanPalauPanamaPapua New GuineaParaguayPeruPhilippinesPolandPortugalPost-demographic dividendPre-demographic dividendPuerto RicoQatarRomaniaRussian FederationRwandaSamoaSao Tome and PrincipeSaudi ArabiaSenegalSerbiaSeychellesSierra LeoneSingaporeSlovak RepublicSloveniaSmall statesSolomon IslandsSouth AfricaSouth AsiaSouth Asia (IDA & IBRD)South SudanSpainSri LankaSt. Kitts and NevisSt. LuciaSt. Vincent and the GrenadinesSub-Saharan Africa Sub-Saharan Africa (excluding high income)Sub-Saharan Africa (IDA & IBRD countries)SudanSurinameSwazilandSwedenSwitzerlandTajikistanTanzaniaThailandTimor-LesteTogoTongaTrinidad and TobagoTunisiaTurkeyTurkmenistanTuvaluUgandaUkraineUnited Arab EmiratesUnited KingdomUnited StatesUpper middle incomeUruguayUzbekistanVanuatuVenezuela, RBVietnamWest Bank and GazaWorldYemen, Rep.ZambiaZimbabwe Timeline:
This timeline shows a graph from 1991 to 2016 of Gabon. No data until 1990. Number of actual observations by date: 26.
Source name:
World Development Indicators
Source organization:
World Bank, International Comparison Program database.
Categories, topics:
Economy & Growth
Last updated:
apr 23, 2017
Indicators value changes by year
Minimum:
10.76 bln
jan 1, 1991
Maximum:
32.565 bln
jan 1, 2016
At the date of observation
Value
Absolute change
Change from previous value
jan 1, 1991
10.76 bln
+10.76 bln
0.0%
jan 1, 1992
11.811 bln
+1.051 bln
9.77%
jan 1, 1993
11.345 bln
-465.351 mln
-3.94%
jan 1, 1994
11.874 bln
+528.269 mln
4.66%
jan 1, 1995
12.955 bln
+1.082 bln
9.11%
jan 1, 1996
13.641 bln
+686.111 mln
5.3%
jan 1, 1997
14.397 bln
+755.567 mln
5.54%
jan 1, 1998
15.475 bln
+1.078 bln
7.49%
jan 1, 1999
16.553 bln
+1.079 bln
6.97%
jan 1, 2000
15.182 bln
-1.371 bln
-8.28%
jan 1, 2001
14.686 bln
-496.191 mln
-3.27%
jan 1, 2002
15.855 bln
+1.168 bln
7.96%
jan 1, 2003
16.704 bln
+849.638 mln
5.36%
jan 1, 2004
17.045 bln
+340.64 mln
2.04%
jan 1, 2005
16.766 bln
-278.539 mln
-1.63%
jan 1, 2006
19.093 bln
+2.326 bln
13.88%
jan 1, 2007
18.275 bln
-817.436 mln
-4.28%
jan 1, 2008
19.523 bln
+1.248 bln
6.83%
jan 1, 2009
19.428 bln
-95.65 mln
-0.49%
jan 1, 2010
20.177 bln
+749.159 mln
3.86%
jan 1, 2011
21.435 bln
+1.259 bln
6.24%
jan 1, 2012
23.271 bln
+1.836 bln
8.56%
jan 1, 2013
26.027 bln
+2.756 bln
11.84%
jan 1, 2014
28.029 bln
+2.002 bln
7.69%
jan 1, 2015
31.239 bln
+3.21 bln
11.45%
jan 1, 2016
32.565 bln
+1.327 bln
4.25%
Ranking of countries by current statistics by years


Comments: