29
/
en
AIzaSyAYiBZKx7MnpbEhh9jyipgxe19OcubqV5w
April 1, 2024
171732
Kuwait
KWT
true
2
1
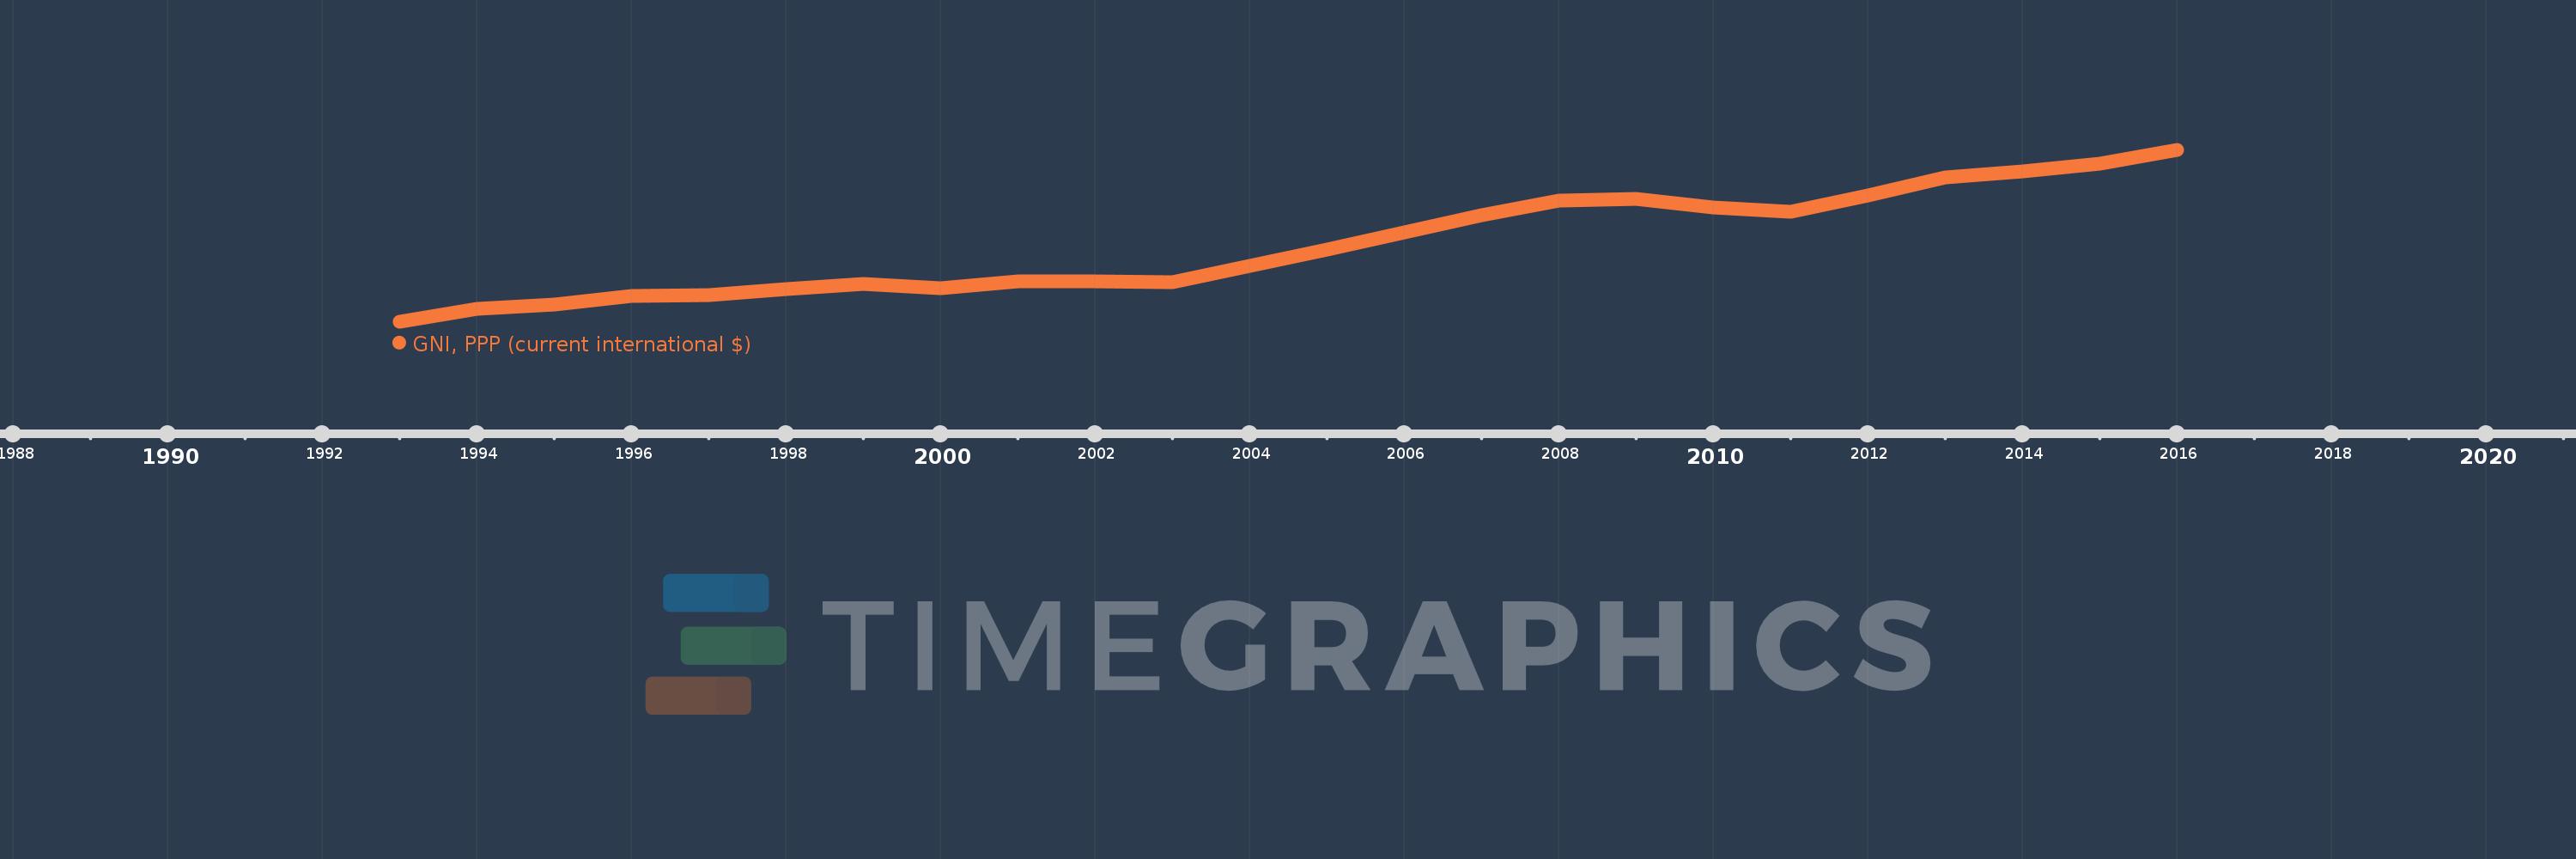
GNI, PPP (current international $)
2016,2015,2014,2013,2012,2011,2010,2009,2008,2007,2006,2005,2004,2003,2002,2001,2000,1999,1998,1997,1996,1995,1994,1993
This statistics in other country:
AfghanistanAlbaniaAlgeriaAngolaAntigua and BarbudaArab WorldArgentinaArmeniaAustraliaAustriaAzerbaijanBahamas, TheBahrainBangladeshBarbadosBelarusBelgiumBelizeBeninBermudaBhutanBoliviaBosnia and HerzegovinaBotswanaBrazilBrunei DarussalamBulgariaBurkina FasoBurundiCabo VerdeCambodiaCameroonCanadaCaribbean small statesCentral African RepublicCentral Europe and the BalticsChadChileChinaColombiaComorosCongo, Dem. Rep.Congo, Rep.Costa RicaCote d'IvoireCroatiaCubaCyprusCzech RepublicDenmarkDjiboutiDominicaDominican RepublicEarly-demographic dividendEast Asia & PacificEast Asia & Pacific (excluding high income)East Asia & Pacific (IDA & IBRD countries)EcuadorEgypt, Arab Rep.El SalvadorEquatorial GuineaEritreaEstoniaEthiopiaEuro areaEurope & Central AsiaEurope & Central Asia (excluding high income)Europe & Central Asia (IDA & IBRD countries)European UnionFijiFinlandFragile and conflict affected situationsFranceGabonGambia, TheGeorgiaGermanyGhanaGreeceGrenadaGuatemalaGuineaGuinea-BissauGuyanaHaitiHeavily indebted poor countries (HIPC)High incomeHondurasHong Kong SAR, ChinaHungaryIBRD onlyIcelandIDA & IBRD totalIDA blendIDA onlyIDA totalIndiaIndonesiaIran, Islamic Rep.IraqIrelandIsraelItalyJamaicaJapanJordanKazakhstanKenyaKiribatiKorea, Rep.KosovoKuwaitKyrgyz RepublicLao PDRLate-demographic dividendLatin America & Caribbean Latin America & Caribbean (excluding high income)Latin America & the Caribbean (IDA & IBRD countries)LatviaLeast developed countries: UN classificationLebanonLesothoLiberiaLibyaLithuaniaLow & middle incomeLow incomeLower middle incomeLuxembourgMacao SAR, ChinaMacedonia, FYRMadagascarMalawiMalaysiaMaldivesMaliMaltaMarshall IslandsMauritaniaMauritiusMexicoMicronesia, Fed. Sts.Middle East & North AfricaMiddle East & North Africa (excluding high income)Middle East & North Africa (IDA & IBRD countries)Middle incomeMoldovaMongoliaMontenegroMoroccoMozambiqueMyanmarNamibiaNauruNepalNetherlandsNew ZealandNicaraguaNigerNigeriaNorth AmericaNorwayOECD membersOmanOther small statesPacific island small statesPakistanPalauPanamaPapua New GuineaParaguayPeruPhilippinesPolandPortugalPost-demographic dividendPre-demographic dividendPuerto RicoQatarRomaniaRussian FederationRwandaSamoaSao Tome and PrincipeSaudi ArabiaSenegalSerbiaSeychellesSierra LeoneSingaporeSlovak RepublicSloveniaSmall statesSolomon IslandsSouth AfricaSouth AsiaSouth Asia (IDA & IBRD)South SudanSpainSri LankaSt. Kitts and NevisSt. LuciaSt. Vincent and the GrenadinesSub-Saharan Africa Sub-Saharan Africa (excluding high income)Sub-Saharan Africa (IDA & IBRD countries)SudanSurinameSwazilandSwedenSwitzerlandTajikistanTanzaniaThailandTimor-LesteTogoTongaTrinidad and TobagoTunisiaTurkeyTurkmenistanTuvaluUgandaUkraineUnited Arab EmiratesUnited KingdomUnited StatesUpper middle incomeUruguayUzbekistanVanuatuVenezuela, RBVietnamWest Bank and GazaWorldYemen, Rep.ZambiaZimbabwe Timeline:
This timeline shows a graph from 1993 to 2016 of Kuwait. No data until 1992. Number of actual observations by date: 24.
Source name:
World Development Indicators
Source organization:
World Bank, International Comparison Program database.
Categories, topics:
Economy & Growth
Last updated:
apr 23, 2017
Indicators value changes by year
Minimum:
73.948 bln
jan 1, 1993
Maximum:
328.321 bln
jan 1, 2016
At the date of observation
Value
Absolute change
Change from previous value
jan 1, 1993
73.948 bln
+73.948 bln
0.0%
jan 1, 1994
93.084 bln
+19.136 bln
25.88%
jan 1, 1995
100.211 bln
+7.127 bln
7.66%
jan 1, 1996
112.225 bln
+12.013 bln
11.99%
jan 1, 1997
113.492 bln
+1.267 bln
1.13%
jan 1, 1998
122.598 bln
+9.106 bln
8.02%
jan 1, 1999
130.515 bln
+7.918 bln
6.46%
jan 1, 2000
124.153 bln
-6.362 bln
-4.87%
jan 1, 2001
133.84 bln
+9.687 bln
7.8%
jan 1, 2002
133.537 bln
-303.097 mln
-0.23%
jan 1, 2003
133.126 bln
-410.529 mln
-0.31%
jan 1, 2004
156.82 bln
+23.694 bln
17.8%
jan 1, 2005
181.318 bln
+24.498 bln
15.62%
jan 1, 2006
206.312 bln
+24.994 bln
13.78%
jan 1, 2007
232.651 bln
+26.339 bln
12.77%
jan 1, 2008
253.189 bln
+20.538 bln
8.83%
jan 1, 2009
256.142 bln
+2.953 bln
1.17%
jan 1, 2010
243.335 bln
-12.806 bln
-5.0%
jan 1, 2011
237.103 bln
-6.232 bln
-2.56%
jan 1, 2012
261.91 bln
+24.806 bln
10.46%
jan 1, 2013
287.99 bln
+26.08 bln
9.96%
jan 1, 2014
296.876 bln
+8.886 bln
3.09%
jan 1, 2015
307.82 bln
+10.945 bln
3.69%
jan 1, 2016
328.321 bln
+20.501 bln
6.66%
Ranking of countries by current statistics by years


Comments: