29
/
en
AIzaSyAYiBZKx7MnpbEhh9jyipgxe19OcubqV5w
April 1, 2024
77146
Bahrain
BHR
true
2
1
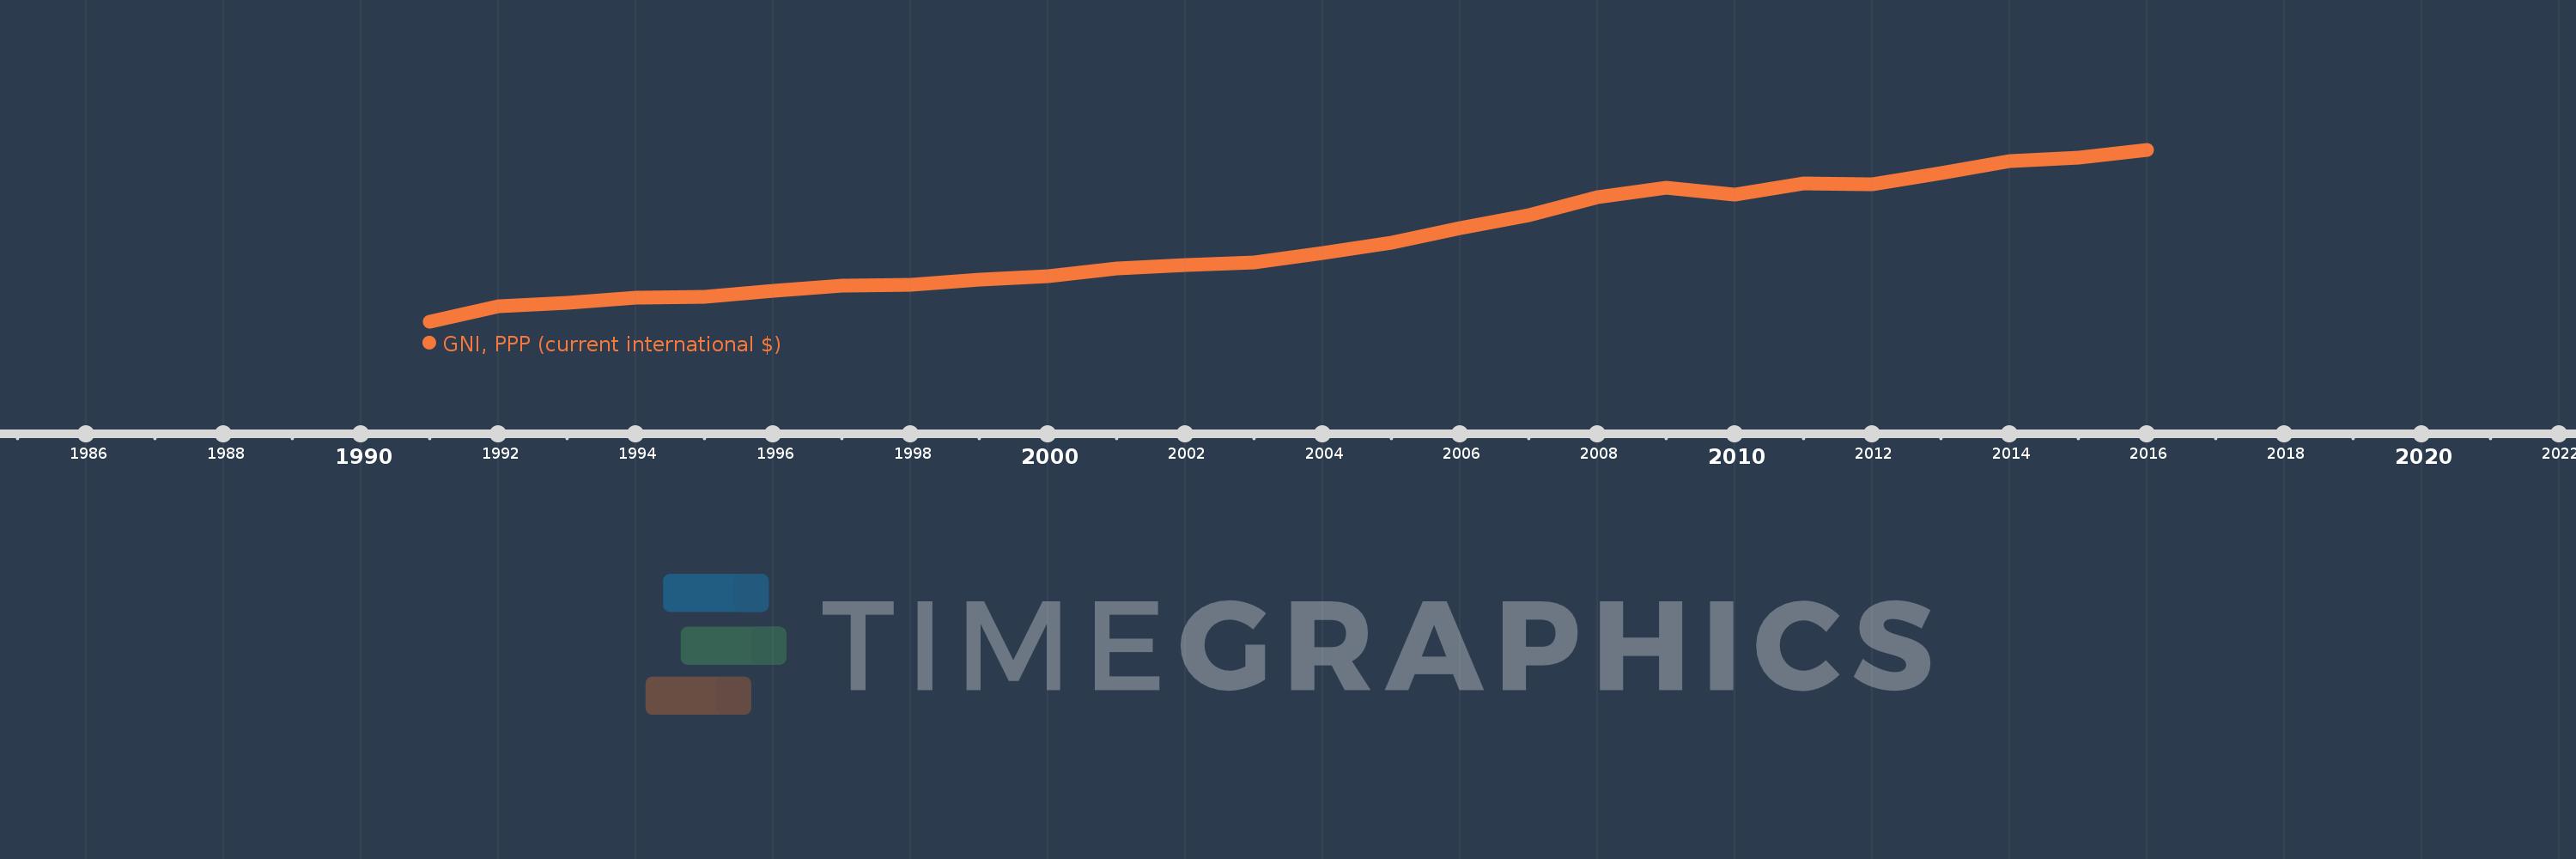
GNI, PPP (current international $)
2016,2015,2014,2013,2012,2011,2010,2009,2008,2007,2006,2005,2004,2003,2002,2001,2000,1999,1998,1997,1996,1995,1994,1993,1992,1991
This statistics in other country:
AfghanistanAlbaniaAlgeriaAngolaAntigua and BarbudaArab WorldArgentinaArmeniaAustraliaAustriaAzerbaijanBahamas, TheBahrainBangladeshBarbadosBelarusBelgiumBelizeBeninBermudaBhutanBoliviaBosnia and HerzegovinaBotswanaBrazilBrunei DarussalamBulgariaBurkina FasoBurundiCabo VerdeCambodiaCameroonCanadaCaribbean small statesCentral African RepublicCentral Europe and the BalticsChadChileChinaColombiaComorosCongo, Dem. Rep.Congo, Rep.Costa RicaCote d'IvoireCroatiaCubaCyprusCzech RepublicDenmarkDjiboutiDominicaDominican RepublicEarly-demographic dividendEast Asia & PacificEast Asia & Pacific (excluding high income)East Asia & Pacific (IDA & IBRD countries)EcuadorEgypt, Arab Rep.El SalvadorEquatorial GuineaEritreaEstoniaEthiopiaEuro areaEurope & Central AsiaEurope & Central Asia (excluding high income)Europe & Central Asia (IDA & IBRD countries)European UnionFijiFinlandFragile and conflict affected situationsFranceGabonGambia, TheGeorgiaGermanyGhanaGreeceGrenadaGuatemalaGuineaGuinea-BissauGuyanaHaitiHeavily indebted poor countries (HIPC)High incomeHondurasHong Kong SAR, ChinaHungaryIBRD onlyIcelandIDA & IBRD totalIDA blendIDA onlyIDA totalIndiaIndonesiaIran, Islamic Rep.IraqIrelandIsraelItalyJamaicaJapanJordanKazakhstanKenyaKiribatiKorea, Rep.KosovoKuwaitKyrgyz RepublicLao PDRLate-demographic dividendLatin America & Caribbean Latin America & Caribbean (excluding high income)Latin America & the Caribbean (IDA & IBRD countries)LatviaLeast developed countries: UN classificationLebanonLesothoLiberiaLibyaLithuaniaLow & middle incomeLow incomeLower middle incomeLuxembourgMacao SAR, ChinaMacedonia, FYRMadagascarMalawiMalaysiaMaldivesMaliMaltaMarshall IslandsMauritaniaMauritiusMexicoMicronesia, Fed. Sts.Middle East & North AfricaMiddle East & North Africa (excluding high income)Middle East & North Africa (IDA & IBRD countries)Middle incomeMoldovaMongoliaMontenegroMoroccoMozambiqueMyanmarNamibiaNauruNepalNetherlandsNew ZealandNicaraguaNigerNigeriaNorth AmericaNorwayOECD membersOmanOther small statesPacific island small statesPakistanPalauPanamaPapua New GuineaParaguayPeruPhilippinesPolandPortugalPost-demographic dividendPre-demographic dividendPuerto RicoQatarRomaniaRussian FederationRwandaSamoaSao Tome and PrincipeSaudi ArabiaSenegalSerbiaSeychellesSierra LeoneSingaporeSlovak RepublicSloveniaSmall statesSolomon IslandsSouth AfricaSouth AsiaSouth Asia (IDA & IBRD)South SudanSpainSri LankaSt. Kitts and NevisSt. LuciaSt. Vincent and the GrenadinesSub-Saharan Africa Sub-Saharan Africa (excluding high income)Sub-Saharan Africa (IDA & IBRD countries)SudanSurinameSwazilandSwedenSwitzerlandTajikistanTanzaniaThailandTimor-LesteTogoTongaTrinidad and TobagoTunisiaTurkeyTurkmenistanTuvaluUgandaUkraineUnited Arab EmiratesUnited KingdomUnited StatesUpper middle incomeUruguayUzbekistanVanuatuVenezuela, RBVietnamWest Bank and GazaWorldYemen, Rep.ZambiaZimbabwe Timeline:
This timeline shows a graph from 1991 to 2016 of Bahrain. No data until 1990. Number of actual observations by date: 26.
Source name:
World Development Indicators
Source organization:
World Bank, International Comparison Program database.
Categories, topics:
Economy & Growth
Last updated:
apr 23, 2017
Indicators value changes by year
Minimum:
9.426 bln
jan 1, 1991
Maximum:
53.239 bln
jan 1, 2016
At the date of observation
Value
Absolute change
Change from previous value
jan 1, 1991
9.426 bln
+9.426 bln
0.0%
jan 1, 1992
13.471 bln
+4.045 bln
42.92%
jan 1, 1993
14.21 bln
+738.932 mln
5.49%
jan 1, 1994
15.704 bln
+1.494 bln
10.52%
jan 1, 1995
15.895 bln
+190.457 mln
1.21%
jan 1, 1996
17.452 bln
+1.558 bln
9.8%
jan 1, 1997
18.613 bln
+1.16 bln
6.65%
jan 1, 1998
18.869 bln
+256.267 mln
1.38%
jan 1, 1999
20.217 bln
+1.348 bln
7.14%
jan 1, 2000
21.085 bln
+867.911 mln
4.29%
jan 1, 2001
23.091 bln
+2.007 bln
9.52%
jan 1, 2002
23.929 bln
+838.016 mln
3.63%
jan 1, 2003
24.687 bln
+757.633 mln
3.17%
jan 1, 2004
26.978 bln
+2.291 bln
9.28%
jan 1, 2005
29.679 bln
+2.702 bln
10.01%
jan 1, 2006
33.318 bln
+3.639 bln
12.26%
jan 1, 2007
36.752 bln
+3.434 bln
10.31%
jan 1, 2008
41.155 bln
+4.403 bln
11.98%
jan 1, 2009
43.581 bln
+2.425 bln
5.89%
jan 1, 2010
41.819 bln
-1.762 bln
-4.04%
jan 1, 2011
44.772 bln
+2.953 bln
7.06%
jan 1, 2012
44.625 bln
-147.056 mln
-0.33%
jan 1, 2013
47.468 bln
+2.843 bln
6.37%
jan 1, 2014
50.447 bln
+2.978 bln
6.27%
jan 1, 2015
51.242 bln
+794.813 mln
1.58%
jan 1, 2016
53.239 bln
+1.998 bln
3.9%
Ranking of countries by current statistics by years


Comments: