29
/
en
AIzaSyAYiBZKx7MnpbEhh9jyipgxe19OcubqV5w
April 1, 2024
127376
Equatorial Guinea
GNQ
true
2
1
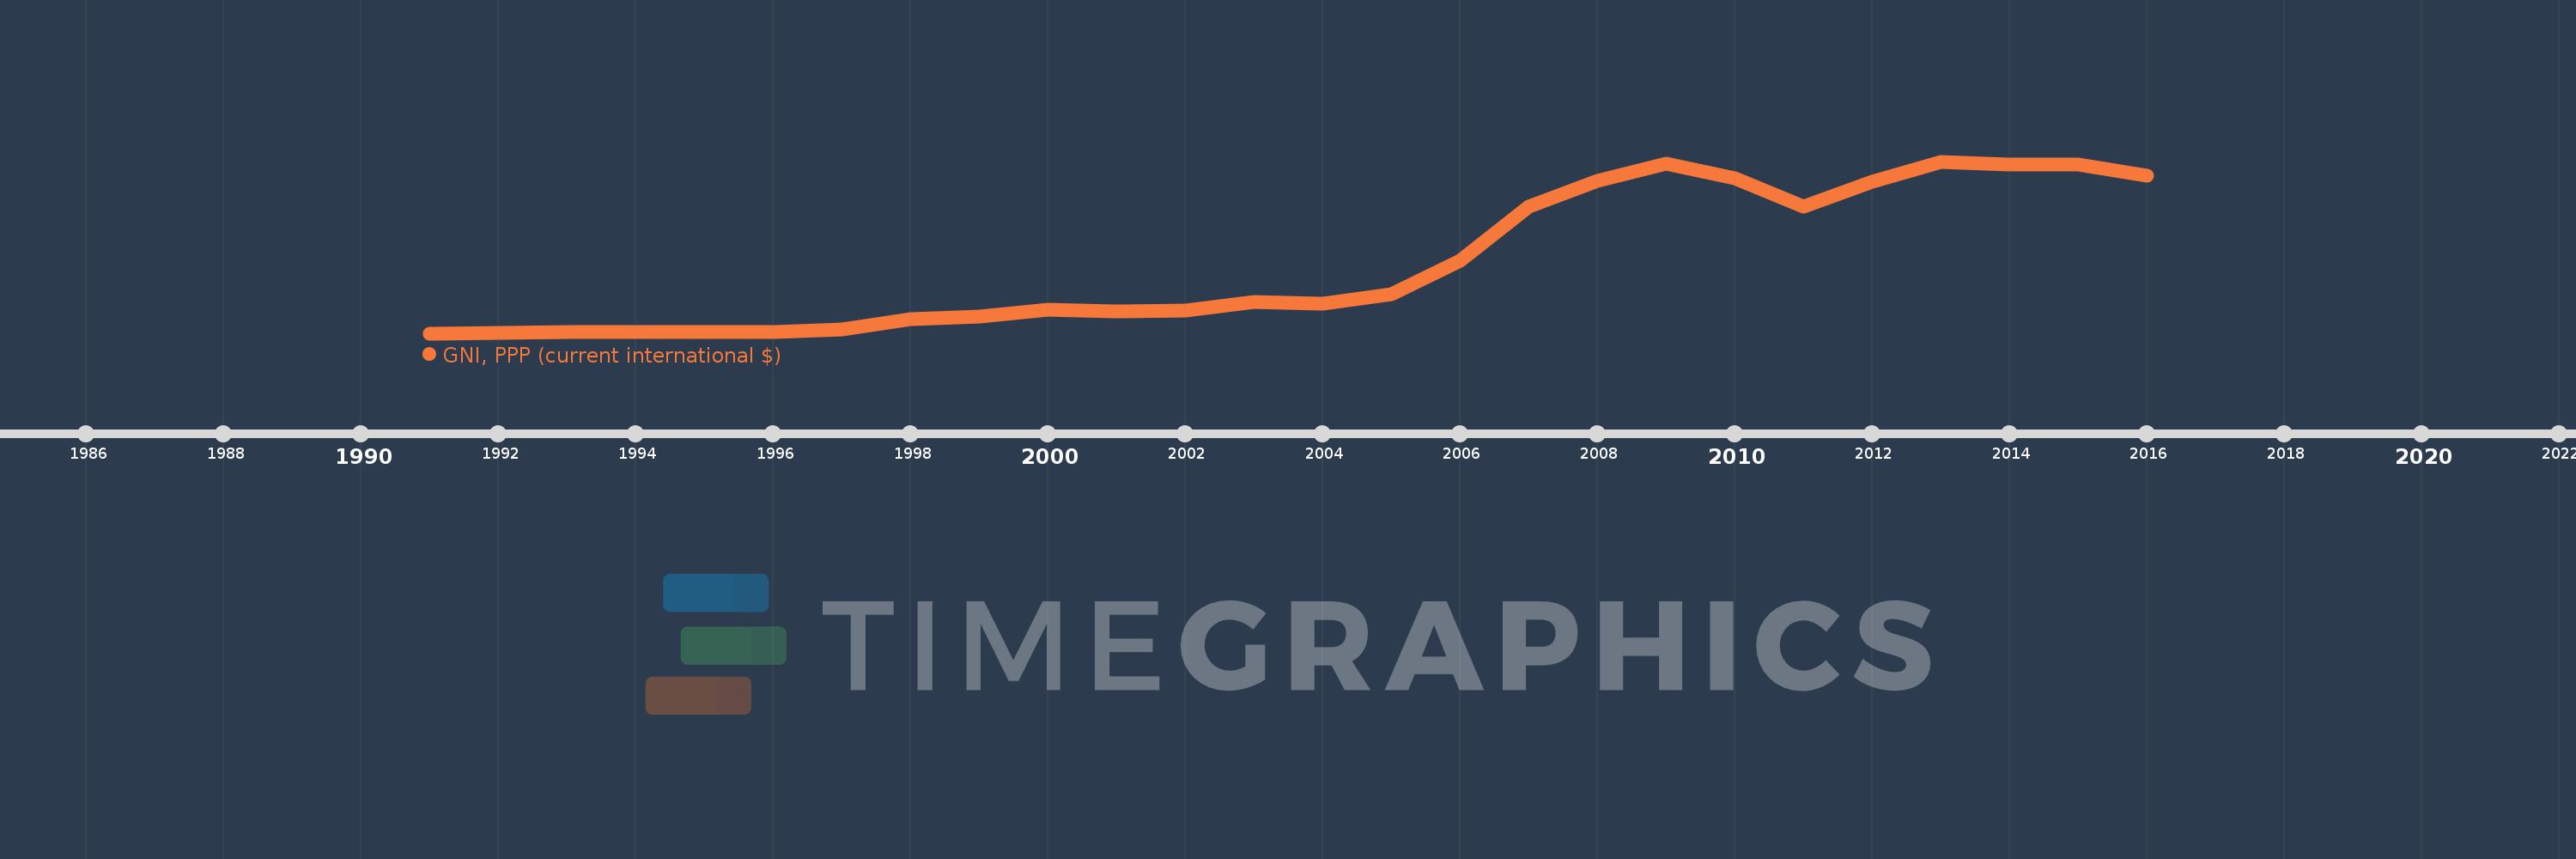
GNI, PPP (current international $)
2016,2015,2014,2013,2012,2011,2010,2009,2008,2007,2006,2005,2004,2003,2002,2001,2000,1999,1998,1997,1996,1995,1994,1993,1992,1991
This statistics in other country:
AfghanistanAlbaniaAlgeriaAngolaAntigua and BarbudaArab WorldArgentinaArmeniaAustraliaAustriaAzerbaijanBahamas, TheBahrainBangladeshBarbadosBelarusBelgiumBelizeBeninBermudaBhutanBoliviaBosnia and HerzegovinaBotswanaBrazilBrunei DarussalamBulgariaBurkina FasoBurundiCabo VerdeCambodiaCameroonCanadaCaribbean small statesCentral African RepublicCentral Europe and the BalticsChadChileChinaColombiaComorosCongo, Dem. Rep.Congo, Rep.Costa RicaCote d'IvoireCroatiaCubaCyprusCzech RepublicDenmarkDjiboutiDominicaDominican RepublicEarly-demographic dividendEast Asia & PacificEast Asia & Pacific (excluding high income)East Asia & Pacific (IDA & IBRD countries)EcuadorEgypt, Arab Rep.El SalvadorEquatorial GuineaEritreaEstoniaEthiopiaEuro areaEurope & Central AsiaEurope & Central Asia (excluding high income)Europe & Central Asia (IDA & IBRD countries)European UnionFijiFinlandFragile and conflict affected situationsFranceGabonGambia, TheGeorgiaGermanyGhanaGreeceGrenadaGuatemalaGuineaGuinea-BissauGuyanaHaitiHeavily indebted poor countries (HIPC)High incomeHondurasHong Kong SAR, ChinaHungaryIBRD onlyIcelandIDA & IBRD totalIDA blendIDA onlyIDA totalIndiaIndonesiaIran, Islamic Rep.IraqIrelandIsraelItalyJamaicaJapanJordanKazakhstanKenyaKiribatiKorea, Rep.KosovoKuwaitKyrgyz RepublicLao PDRLate-demographic dividendLatin America & Caribbean Latin America & Caribbean (excluding high income)Latin America & the Caribbean (IDA & IBRD countries)LatviaLeast developed countries: UN classificationLebanonLesothoLiberiaLibyaLithuaniaLow & middle incomeLow incomeLower middle incomeLuxembourgMacao SAR, ChinaMacedonia, FYRMadagascarMalawiMalaysiaMaldivesMaliMaltaMarshall IslandsMauritaniaMauritiusMexicoMicronesia, Fed. Sts.Middle East & North AfricaMiddle East & North Africa (excluding high income)Middle East & North Africa (IDA & IBRD countries)Middle incomeMoldovaMongoliaMontenegroMoroccoMozambiqueMyanmarNamibiaNauruNepalNetherlandsNew ZealandNicaraguaNigerNigeriaNorth AmericaNorwayOECD membersOmanOther small statesPacific island small statesPakistanPalauPanamaPapua New GuineaParaguayPeruPhilippinesPolandPortugalPost-demographic dividendPre-demographic dividendPuerto RicoQatarRomaniaRussian FederationRwandaSamoaSao Tome and PrincipeSaudi ArabiaSenegalSerbiaSeychellesSierra LeoneSingaporeSlovak RepublicSloveniaSmall statesSolomon IslandsSouth AfricaSouth AsiaSouth Asia (IDA & IBRD)South SudanSpainSri LankaSt. Kitts and NevisSt. LuciaSt. Vincent and the GrenadinesSub-Saharan Africa Sub-Saharan Africa (excluding high income)Sub-Saharan Africa (IDA & IBRD countries)SudanSurinameSwazilandSwedenSwitzerlandTajikistanTanzaniaThailandTimor-LesteTogoTongaTrinidad and TobagoTunisiaTurkeyTurkmenistanTuvaluUgandaUkraineUnited Arab EmiratesUnited KingdomUnited StatesUpper middle incomeUruguayUzbekistanVanuatuVenezuela, RBVietnamWest Bank and GazaWorldYemen, Rep.ZambiaZimbabwe Timeline:
This timeline shows a graph from 1991 to 2016 of Equatorial Guinea. No data until 1990. Number of actual observations by date: 26.
Source name:
World Development Indicators
Source organization:
World Bank, International Comparison Program database.
Categories, topics:
Economy & Growth
Last updated:
apr 23, 2017
Indicators value changes by year
Minimum:
294.157 mln
jan 1, 1991
Maximum:
24.989 bln
jan 1, 2013
At the date of observation
Value
Absolute change
Change from previous value
jan 1, 1991
294.157 mln
+294.157 mln
0.0%
jan 1, 1992
308.261 mln
+14.104 mln
4.79%
jan 1, 1993
432.17 mln
+123.908 mln
40.2%
jan 1, 1994
482.413 mln
+50.243 mln
11.63%
jan 1, 1995
482.281 mln
-131.507K
-0.03%
jan 1, 1996
525.242 mln
+42.961 mln
8.91%
jan 1, 1997
863.545 mln
+338.303 mln
64.41%
jan 1, 1998
2.385 bln
+1.521 bln
176.14%
jan 1, 1999
2.669 bln
+284.166 mln
11.92%
jan 1, 2000
3.641 bln
+971.958 mln
36.42%
jan 1, 2001
3.395 bln
-245.295 mln
-6.74%
jan 1, 2002
3.532 bln
+136.32 mln
4.01%
jan 1, 2003
4.843 bln
+1.311 bln
37.12%
jan 1, 2004
4.605 bln
-237.636 mln
-4.91%
jan 1, 2005
5.896 bln
+1.291 bln
28.04%
jan 1, 2006
10.743 bln
+4.847 bln
82.2%
jan 1, 2007
18.486 bln
+7.743 bln
72.07%
jan 1, 2008
22.221 bln
+3.735 bln
20.21%
jan 1, 2009
24.741 bln
+2.52 bln
11.34%
jan 1, 2010
22.545 bln
-2.196 bln
-8.87%
jan 1, 2011
18.45 bln
-4.095 bln
-18.16%
jan 1, 2012
22.108 bln
+3.657 bln
19.82%
jan 1, 2013
24.989 bln
+2.881 bln
13.03%
jan 1, 2014
24.563 bln
-426.188 mln
-1.71%
jan 1, 2015
24.515 bln
-47.639 mln
-0.19%
jan 1, 2016
22.986 bln
-1.529 bln
-6.24%
Ranking of countries by current statistics by years


Comments: