29
/
en
AIzaSyAYiBZKx7MnpbEhh9jyipgxe19OcubqV5w
April 1, 2024
54086
Pacific island small states
PSS
false
2
1
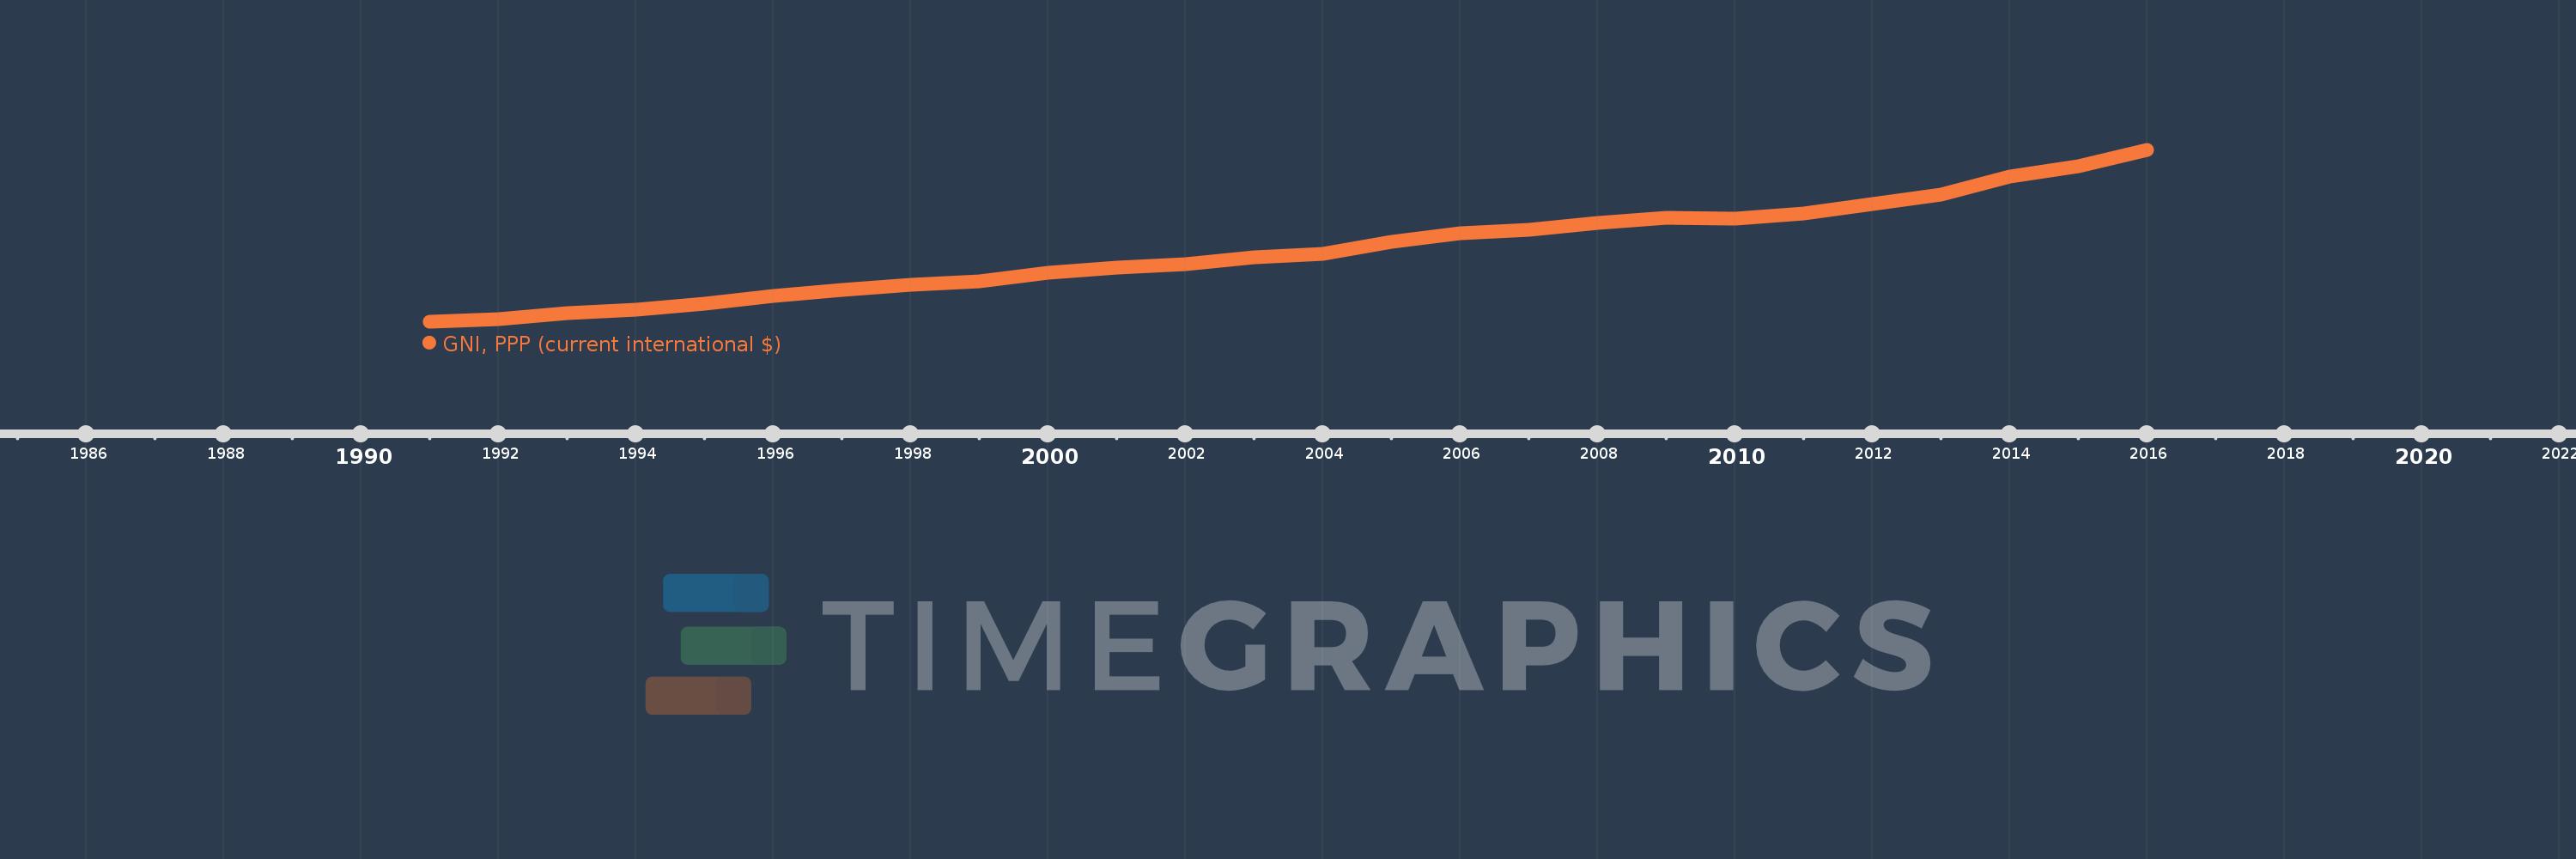
GNI, PPP (current international $)
2016,2015,2014,2013,2012,2011,2010,2009,2008,2007,2006,2005,2004,2003,2002,2001,2000,1999,1998,1997,1996,1995,1994,1993,1992,1991
This statistics in other country:
AfghanistanAlbaniaAlgeriaAngolaAntigua and BarbudaArab WorldArgentinaArmeniaAustraliaAustriaAzerbaijanBahamas, TheBahrainBangladeshBarbadosBelarusBelgiumBelizeBeninBermudaBhutanBoliviaBosnia and HerzegovinaBotswanaBrazilBrunei DarussalamBulgariaBurkina FasoBurundiCabo VerdeCambodiaCameroonCanadaCaribbean small statesCentral African RepublicCentral Europe and the BalticsChadChileChinaColombiaComorosCongo, Dem. Rep.Congo, Rep.Costa RicaCote d'IvoireCroatiaCubaCyprusCzech RepublicDenmarkDjiboutiDominicaDominican RepublicEarly-demographic dividendEast Asia & PacificEast Asia & Pacific (excluding high income)East Asia & Pacific (IDA & IBRD countries)EcuadorEgypt, Arab Rep.El SalvadorEquatorial GuineaEritreaEstoniaEthiopiaEuro areaEurope & Central AsiaEurope & Central Asia (excluding high income)Europe & Central Asia (IDA & IBRD countries)European UnionFijiFinlandFragile and conflict affected situationsFranceGabonGambia, TheGeorgiaGermanyGhanaGreeceGrenadaGuatemalaGuineaGuinea-BissauGuyanaHaitiHeavily indebted poor countries (HIPC)High incomeHondurasHong Kong SAR, ChinaHungaryIBRD onlyIcelandIDA & IBRD totalIDA blendIDA onlyIDA totalIndiaIndonesiaIran, Islamic Rep.IraqIrelandIsraelItalyJamaicaJapanJordanKazakhstanKenyaKiribatiKorea, Rep.KosovoKuwaitKyrgyz RepublicLao PDRLate-demographic dividendLatin America & Caribbean Latin America & Caribbean (excluding high income)Latin America & the Caribbean (IDA & IBRD countries)LatviaLeast developed countries: UN classificationLebanonLesothoLiberiaLibyaLithuaniaLow & middle incomeLow incomeLower middle incomeLuxembourgMacao SAR, ChinaMacedonia, FYRMadagascarMalawiMalaysiaMaldivesMaliMaltaMarshall IslandsMauritaniaMauritiusMexicoMicronesia, Fed. Sts.Middle East & North AfricaMiddle East & North Africa (excluding high income)Middle East & North Africa (IDA & IBRD countries)Middle incomeMoldovaMongoliaMontenegroMoroccoMozambiqueMyanmarNamibiaNauruNepalNetherlandsNew ZealandNicaraguaNigerNigeriaNorth AmericaNorwayOECD membersOmanOther small statesPacific island small statesPakistanPalauPanamaPapua New GuineaParaguayPeruPhilippinesPolandPortugalPost-demographic dividendPre-demographic dividendPuerto RicoQatarRomaniaRussian FederationRwandaSamoaSao Tome and PrincipeSaudi ArabiaSenegalSerbiaSeychellesSierra LeoneSingaporeSlovak RepublicSloveniaSmall statesSolomon IslandsSouth AfricaSouth AsiaSouth Asia (IDA & IBRD)South SudanSpainSri LankaSt. Kitts and NevisSt. LuciaSt. Vincent and the GrenadinesSub-Saharan Africa Sub-Saharan Africa (excluding high income)Sub-Saharan Africa (IDA & IBRD countries)SudanSurinameSwazilandSwedenSwitzerlandTajikistanTanzaniaThailandTimor-LesteTogoTongaTrinidad and TobagoTunisiaTurkeyTurkmenistanTuvaluUgandaUkraineUnited Arab EmiratesUnited KingdomUnited StatesUpper middle incomeUruguayUzbekistanVanuatuVenezuela, RBVietnamWest Bank and GazaWorldYemen, Rep.ZambiaZimbabwe Timeline:
This timeline shows a graph from 1991 to 2016 of Pacific island small states. No data until 1990. Number of actual observations by date: 26.
Source name:
World Development Indicators
Source organization:
World Bank, International Comparison Program database.
Categories, topics:
Economy & Growth
Last updated:
apr 23, 2017
Indicators value changes by year
Minimum:
4.468 bln
jan 1, 1991
Maximum:
13.393 bln
jan 1, 2016
At the date of observation
Value
Absolute change
Change from previous value
jan 1, 1991
4.468 bln
+4.468 bln
0.0%
jan 1, 1992
4.619 bln
+151.405 mln
3.39%
jan 1, 1993
4.929 bln
+309.845 mln
6.71%
jan 1, 1994
5.114 bln
+185.043 mln
3.75%
jan 1, 1995
5.415 bln
+300.599 mln
5.88%
jan 1, 1996
5.834 bln
+418.648 mln
7.73%
jan 1, 1997
6.114 bln
+280.535 mln
4.81%
jan 1, 1998
6.412 bln
+297.375 mln
4.86%
jan 1, 1999
6.564 bln
+152.671 mln
2.38%
jan 1, 2000
7.006 bln
+441.813 mln
6.73%
jan 1, 2001
7.302 bln
+296.108 mln
4.23%
jan 1, 2002
7.478 bln
+175.518 mln
2.4%
jan 1, 2003
7.82 bln
+342.849 mln
4.58%
jan 1, 2004
8.016 bln
+195.351 mln
2.5%
jan 1, 2005
8.618 bln
+601.953 mln
7.51%
jan 1, 2006
9.09 bln
+472.296 mln
5.48%
jan 1, 2007
9.265 bln
+174.72 mln
1.92%
jan 1, 2008
9.621 bln
+355.708 mln
3.84%
jan 1, 2009
9.894 bln
+273.309 mln
2.84%
jan 1, 2010
9.829 bln
-64.396 mln
-0.65%
jan 1, 2011
10.098 bln
+268.743 mln
2.73%
jan 1, 2012
10.585 bln
+486.789 mln
4.82%
jan 1, 2013
11.101 bln
+516.339 mln
4.88%
jan 1, 2014
12.015 bln
+914.138 mln
8.23%
jan 1, 2015
12.575 bln
+559.472 mln
4.66%
jan 1, 2016
13.393 bln
+817.786 mln
6.5%
Ranking of countries by current statistics by years


Comments: