29
/
en
AIzaSyAYiBZKx7MnpbEhh9jyipgxe19OcubqV5w
April 1, 2024
215306
Oman
OMN
true
2
1
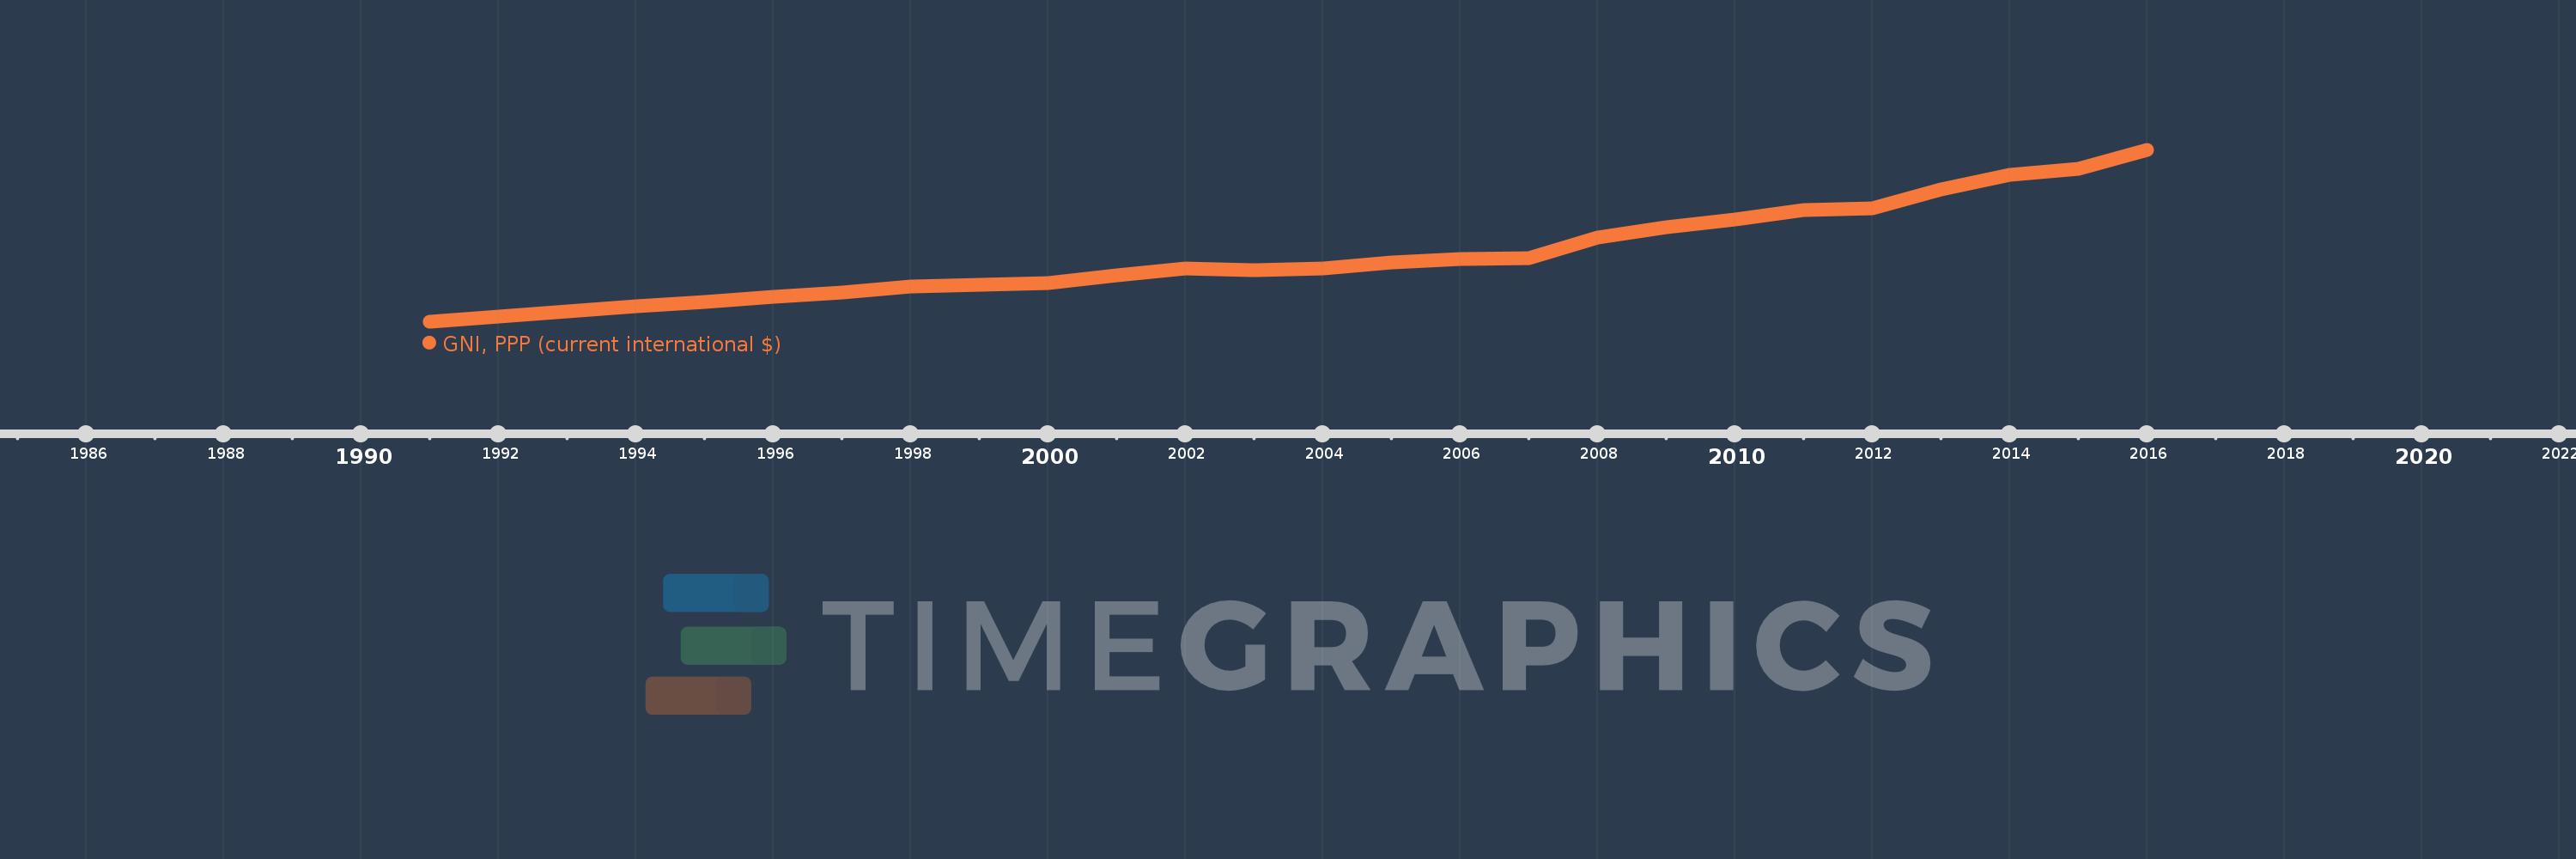
GNI, PPP (current international $)
2016,2015,2014,2013,2012,2011,2010,2009,2008,2007,2006,2005,2004,2003,2002,2001,2000,1999,1998,1997,1996,1995,1994,1993,1992,1991
This statistics in other country:
AfghanistanAlbaniaAlgeriaAngolaAntigua and BarbudaArab WorldArgentinaArmeniaAustraliaAustriaAzerbaijanBahamas, TheBahrainBangladeshBarbadosBelarusBelgiumBelizeBeninBermudaBhutanBoliviaBosnia and HerzegovinaBotswanaBrazilBrunei DarussalamBulgariaBurkina FasoBurundiCabo VerdeCambodiaCameroonCanadaCaribbean small statesCentral African RepublicCentral Europe and the BalticsChadChileChinaColombiaComorosCongo, Dem. Rep.Congo, Rep.Costa RicaCote d'IvoireCroatiaCubaCyprusCzech RepublicDenmarkDjiboutiDominicaDominican RepublicEarly-demographic dividendEast Asia & PacificEast Asia & Pacific (excluding high income)East Asia & Pacific (IDA & IBRD countries)EcuadorEgypt, Arab Rep.El SalvadorEquatorial GuineaEritreaEstoniaEthiopiaEuro areaEurope & Central AsiaEurope & Central Asia (excluding high income)Europe & Central Asia (IDA & IBRD countries)European UnionFijiFinlandFragile and conflict affected situationsFranceGabonGambia, TheGeorgiaGermanyGhanaGreeceGrenadaGuatemalaGuineaGuinea-BissauGuyanaHaitiHeavily indebted poor countries (HIPC)High incomeHondurasHong Kong SAR, ChinaHungaryIBRD onlyIcelandIDA & IBRD totalIDA blendIDA onlyIDA totalIndiaIndonesiaIran, Islamic Rep.IraqIrelandIsraelItalyJamaicaJapanJordanKazakhstanKenyaKiribatiKorea, Rep.KosovoKuwaitKyrgyz RepublicLao PDRLate-demographic dividendLatin America & Caribbean Latin America & Caribbean (excluding high income)Latin America & the Caribbean (IDA & IBRD countries)LatviaLeast developed countries: UN classificationLebanonLesothoLiberiaLibyaLithuaniaLow & middle incomeLow incomeLower middle incomeLuxembourgMacao SAR, ChinaMacedonia, FYRMadagascarMalawiMalaysiaMaldivesMaliMaltaMarshall IslandsMauritaniaMauritiusMexicoMicronesia, Fed. Sts.Middle East & North AfricaMiddle East & North Africa (excluding high income)Middle East & North Africa (IDA & IBRD countries)Middle incomeMoldovaMongoliaMontenegroMoroccoMozambiqueMyanmarNamibiaNauruNepalNetherlandsNew ZealandNicaraguaNigerNigeriaNorth AmericaNorwayOECD membersOmanOther small statesPacific island small statesPakistanPalauPanamaPapua New GuineaParaguayPeruPhilippinesPolandPortugalPost-demographic dividendPre-demographic dividendPuerto RicoQatarRomaniaRussian FederationRwandaSamoaSao Tome and PrincipeSaudi ArabiaSenegalSerbiaSeychellesSierra LeoneSingaporeSlovak RepublicSloveniaSmall statesSolomon IslandsSouth AfricaSouth AsiaSouth Asia (IDA & IBRD)South SudanSpainSri LankaSt. Kitts and NevisSt. LuciaSt. Vincent and the GrenadinesSub-Saharan Africa Sub-Saharan Africa (excluding high income)Sub-Saharan Africa (IDA & IBRD countries)SudanSurinameSwazilandSwedenSwitzerlandTajikistanTanzaniaThailandTimor-LesteTogoTongaTrinidad and TobagoTunisiaTurkeyTurkmenistanTuvaluUgandaUkraineUnited Arab EmiratesUnited KingdomUnited StatesUpper middle incomeUruguayUzbekistanVanuatuVenezuela, RBVietnamWest Bank and GazaWorldYemen, Rep.ZambiaZimbabwe Timeline:
This timeline shows a graph from 1991 to 2016 of Oman. No data until 1990. Number of actual observations by date: 26.
Source name:
World Development Indicators
Source organization:
World Bank, International Comparison Program database.
Categories, topics:
Economy & Growth
Last updated:
apr 23, 2017
Indicators value changes by year
Minimum:
39.972 bln
jan 1, 1991
Maximum:
173.539 bln
jan 1, 2016
At the date of observation
Value
Absolute change
Change from previous value
jan 1, 1991
39.972 bln
+39.972 bln
0.0%
jan 1, 1992
44.265 bln
+4.294 bln
10.74%
jan 1, 1993
48.294 bln
+4.028 bln
9.1%
jan 1, 1994
52.482 bln
+4.188 bln
8.67%
jan 1, 1995
55.586 bln
+3.104 bln
5.92%
jan 1, 1996
59.811 bln
+4.225 bln
7.6%
jan 1, 1997
62.558 bln
+2.747 bln
4.59%
jan 1, 1998
67.324 bln
+4.766 bln
7.62%
jan 1, 1999
69.138 bln
+1.814 bln
2.69%
jan 1, 2000
70.149 bln
+1.011 bln
1.46%
jan 1, 2001
75.985 bln
+5.836 bln
8.32%
jan 1, 2002
81.387 bln
+5.402 bln
7.11%
jan 1, 2003
80.347 bln
-1.04 bln
-1.28%
jan 1, 2004
81.735 bln
+1.388 bln
1.73%
jan 1, 2005
85.93 bln
+4.196 bln
5.13%
jan 1, 2006
89.126 bln
+3.195 bln
3.72%
jan 1, 2007
89.901 bln
+775.551 mln
0.87%
jan 1, 2008
105.43 bln
+15.529 bln
17.27%
jan 1, 2009
113.711 bln
+8.28 bln
7.85%
jan 1, 2010
119.66 bln
+5.949 bln
5.23%
jan 1, 2011
126.845 bln
+7.185 bln
6.0%
jan 1, 2012
128.094 bln
+1.249 bln
0.98%
jan 1, 2013
142.911 bln
+14.817 bln
11.57%
jan 1, 2014
154.429 bln
+11.518 bln
8.06%
jan 1, 2015
159.064 bln
+4.635 bln
3.0%
jan 1, 2016
173.539 bln
+14.475 bln
9.1%
Ranking of countries by current statistics by years


Comments: