29
/
en
AIzaSyAYiBZKx7MnpbEhh9jyipgxe19OcubqV5w
April 1, 2024
143013
Grenada
GRD
true
2
1
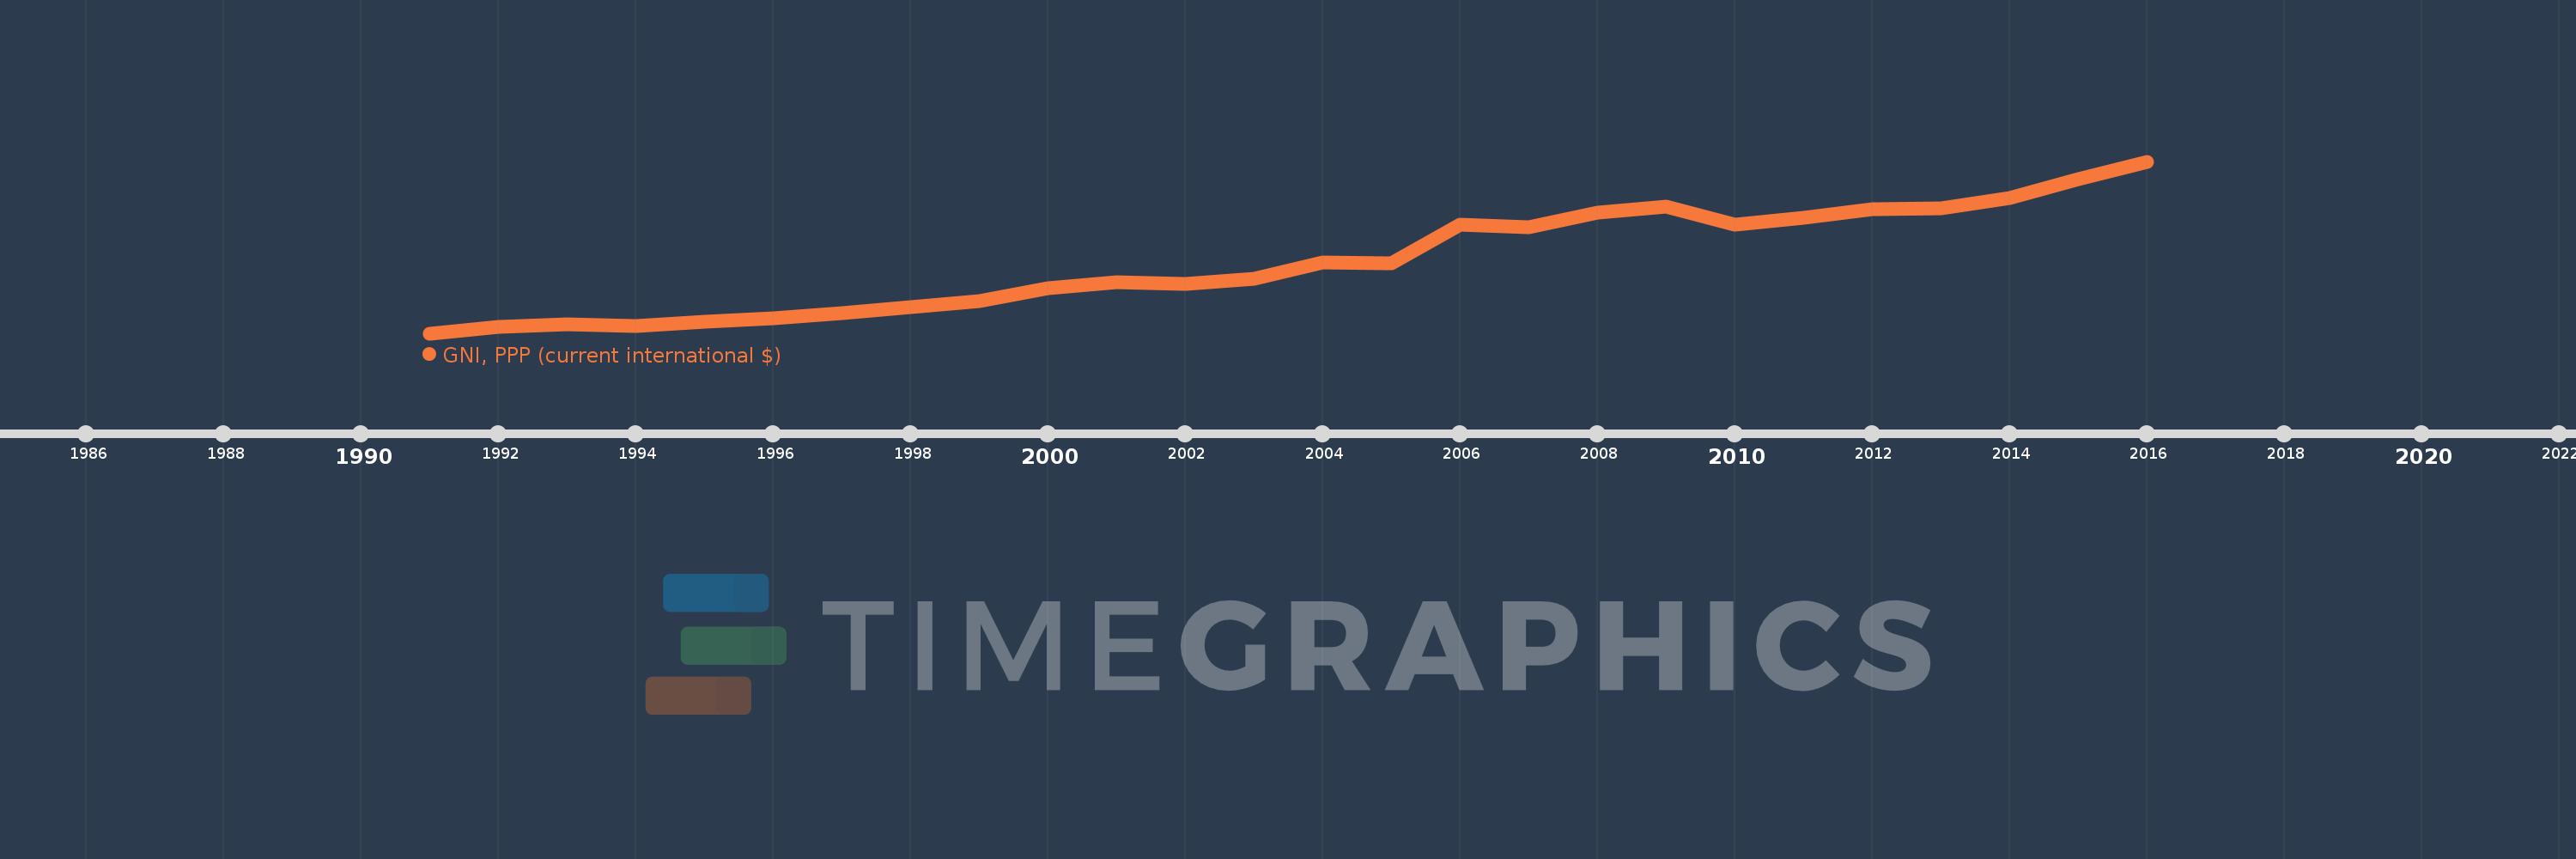
GNI, PPP (current international $)
2016,2015,2014,2013,2012,2011,2010,2009,2008,2007,2006,2005,2004,2003,2002,2001,2000,1999,1998,1997,1996,1995,1994,1993,1992,1991
This statistics in other country:
AfghanistanAlbaniaAlgeriaAngolaAntigua and BarbudaArab WorldArgentinaArmeniaAustraliaAustriaAzerbaijanBahamas, TheBahrainBangladeshBarbadosBelarusBelgiumBelizeBeninBermudaBhutanBoliviaBosnia and HerzegovinaBotswanaBrazilBrunei DarussalamBulgariaBurkina FasoBurundiCabo VerdeCambodiaCameroonCanadaCaribbean small statesCentral African RepublicCentral Europe and the BalticsChadChileChinaColombiaComorosCongo, Dem. Rep.Congo, Rep.Costa RicaCote d'IvoireCroatiaCubaCyprusCzech RepublicDenmarkDjiboutiDominicaDominican RepublicEarly-demographic dividendEast Asia & PacificEast Asia & Pacific (excluding high income)East Asia & Pacific (IDA & IBRD countries)EcuadorEgypt, Arab Rep.El SalvadorEquatorial GuineaEritreaEstoniaEthiopiaEuro areaEurope & Central AsiaEurope & Central Asia (excluding high income)Europe & Central Asia (IDA & IBRD countries)European UnionFijiFinlandFragile and conflict affected situationsFranceGabonGambia, TheGeorgiaGermanyGhanaGreeceGrenadaGuatemalaGuineaGuinea-BissauGuyanaHaitiHeavily indebted poor countries (HIPC)High incomeHondurasHong Kong SAR, ChinaHungaryIBRD onlyIcelandIDA & IBRD totalIDA blendIDA onlyIDA totalIndiaIndonesiaIran, Islamic Rep.IraqIrelandIsraelItalyJamaicaJapanJordanKazakhstanKenyaKiribatiKorea, Rep.KosovoKuwaitKyrgyz RepublicLao PDRLate-demographic dividendLatin America & Caribbean Latin America & Caribbean (excluding high income)Latin America & the Caribbean (IDA & IBRD countries)LatviaLeast developed countries: UN classificationLebanonLesothoLiberiaLibyaLithuaniaLow & middle incomeLow incomeLower middle incomeLuxembourgMacao SAR, ChinaMacedonia, FYRMadagascarMalawiMalaysiaMaldivesMaliMaltaMarshall IslandsMauritaniaMauritiusMexicoMicronesia, Fed. Sts.Middle East & North AfricaMiddle East & North Africa (excluding high income)Middle East & North Africa (IDA & IBRD countries)Middle incomeMoldovaMongoliaMontenegroMoroccoMozambiqueMyanmarNamibiaNauruNepalNetherlandsNew ZealandNicaraguaNigerNigeriaNorth AmericaNorwayOECD membersOmanOther small statesPacific island small statesPakistanPalauPanamaPapua New GuineaParaguayPeruPhilippinesPolandPortugalPost-demographic dividendPre-demographic dividendPuerto RicoQatarRomaniaRussian FederationRwandaSamoaSao Tome and PrincipeSaudi ArabiaSenegalSerbiaSeychellesSierra LeoneSingaporeSlovak RepublicSloveniaSmall statesSolomon IslandsSouth AfricaSouth AsiaSouth Asia (IDA & IBRD)South SudanSpainSri LankaSt. Kitts and NevisSt. LuciaSt. Vincent and the GrenadinesSub-Saharan Africa Sub-Saharan Africa (excluding high income)Sub-Saharan Africa (IDA & IBRD countries)SudanSurinameSwazilandSwedenSwitzerlandTajikistanTanzaniaThailandTimor-LesteTogoTongaTrinidad and TobagoTunisiaTurkeyTurkmenistanTuvaluUgandaUkraineUnited Arab EmiratesUnited KingdomUnited StatesUpper middle incomeUruguayUzbekistanVanuatuVenezuela, RBVietnamWest Bank and GazaWorldYemen, Rep.ZambiaZimbabwe Timeline:
This timeline shows a graph from 1991 to 2016 of Grenada. No data until 1990. Number of actual observations by date: 26.
Source name:
World Development Indicators
Source organization:
World Bank, International Comparison Program database.
Categories, topics:
Economy & Growth
Last updated:
apr 23, 2017
Indicators value changes by year
Minimum:
441.019 mln
jan 1, 1991
Maximum:
1.399 bln
jan 1, 2016
At the date of observation
Value
Absolute change
Change from previous value
jan 1, 1991
441.019 mln
+441.019 mln
0.0%
jan 1, 1992
478.585 mln
+37.565 mln
8.52%
jan 1, 1993
491.676 mln
+13.091 mln
2.74%
jan 1, 1994
483.782 mln
-7.894 mln
-1.61%
jan 1, 1995
507.781 mln
+23.998 mln
4.96%
jan 1, 1996
523.11 mln
+15.33 mln
3.02%
jan 1, 1997
552.172 mln
+29.061 mln
5.56%
jan 1, 1998
585.46 mln
+33.288 mln
6.03%
jan 1, 1999
622.093 mln
+36.633 mln
6.26%
jan 1, 2000
694.43 mln
+72.337 mln
11.63%
jan 1, 2001
726.941 mln
+32.511 mln
4.68%
jan 1, 2002
716.979 mln
-9.963 mln
-1.37%
jan 1, 2003
746.092 mln
+29.113 mln
4.06%
jan 1, 2004
835.411 mln
+89.319 mln
11.97%
jan 1, 2005
831.021 mln
-4.39 mln
-0.53%
jan 1, 2006
1.046 bln
+214.884 mln
25.86%
jan 1, 2007
1.034 bln
-11.912 mln
-1.14%
jan 1, 2008
1.112 bln
+77.735 mln
7.52%
jan 1, 2009
1.147 bln
+35.542 mln
3.2%
jan 1, 2010
1.045 bln
-101.925 mln
-8.88%
jan 1, 2011
1.087 bln
+41.772 mln
4.0%
jan 1, 2012
1.131 bln
+43.801 mln
4.03%
jan 1, 2013
1.136 bln
+5.088 mln
0.45%
jan 1, 2014
1.197 bln
+60.773 mln
5.35%
jan 1, 2015
1.3 bln
+103.652 mln
8.66%
jan 1, 2016
1.399 bln
+98.355 mln
7.56%
Ranking of countries by current statistics by years


Comments: