29
/
en
AIzaSyAYiBZKx7MnpbEhh9jyipgxe19OcubqV5w
April 1, 2024
31610
Europe & Central Asia (excluding high income)
ECA
false
2
1
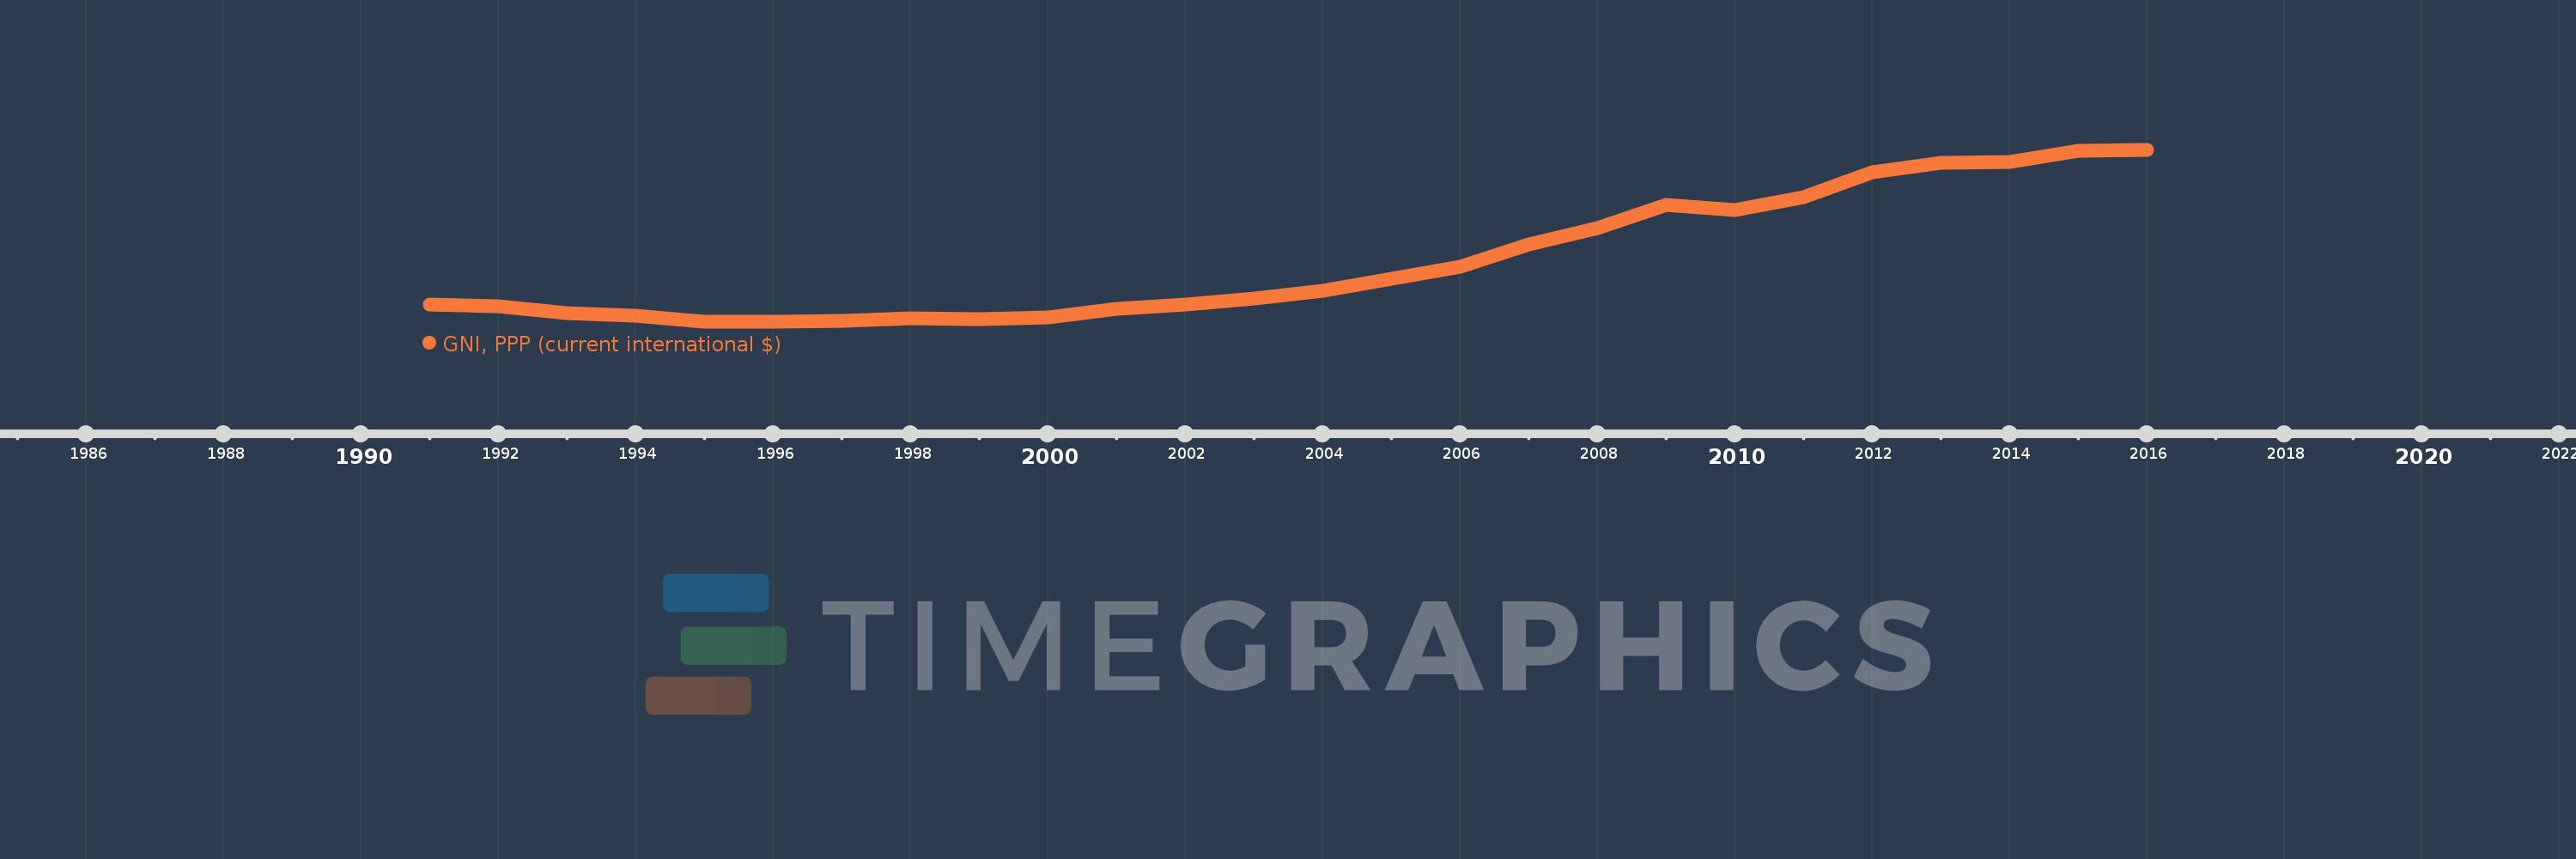
GNI, PPP (current international $)
2016,2015,2014,2013,2012,2011,2010,2009,2008,2007,2006,2005,2004,2003,2002,2001,2000,1999,1998,1997,1996,1995,1994,1993,1992,1991
This statistics in other country:
AfghanistanAlbaniaAlgeriaAngolaAntigua and BarbudaArab WorldArgentinaArmeniaAustraliaAustriaAzerbaijanBahamas, TheBahrainBangladeshBarbadosBelarusBelgiumBelizeBeninBermudaBhutanBoliviaBosnia and HerzegovinaBotswanaBrazilBrunei DarussalamBulgariaBurkina FasoBurundiCabo VerdeCambodiaCameroonCanadaCaribbean small statesCentral African RepublicCentral Europe and the BalticsChadChileChinaColombiaComorosCongo, Dem. Rep.Congo, Rep.Costa RicaCote d'IvoireCroatiaCubaCyprusCzech RepublicDenmarkDjiboutiDominicaDominican RepublicEarly-demographic dividendEast Asia & PacificEast Asia & Pacific (excluding high income)East Asia & Pacific (IDA & IBRD countries)EcuadorEgypt, Arab Rep.El SalvadorEquatorial GuineaEritreaEstoniaEthiopiaEuro areaEurope & Central AsiaEurope & Central Asia (excluding high income)Europe & Central Asia (IDA & IBRD countries)European UnionFijiFinlandFragile and conflict affected situationsFranceGabonGambia, TheGeorgiaGermanyGhanaGreeceGrenadaGuatemalaGuineaGuinea-BissauGuyanaHaitiHeavily indebted poor countries (HIPC)High incomeHondurasHong Kong SAR, ChinaHungaryIBRD onlyIcelandIDA & IBRD totalIDA blendIDA onlyIDA totalIndiaIndonesiaIran, Islamic Rep.IraqIrelandIsraelItalyJamaicaJapanJordanKazakhstanKenyaKiribatiKorea, Rep.KosovoKuwaitKyrgyz RepublicLao PDRLate-demographic dividendLatin America & Caribbean Latin America & Caribbean (excluding high income)Latin America & the Caribbean (IDA & IBRD countries)LatviaLeast developed countries: UN classificationLebanonLesothoLiberiaLibyaLithuaniaLow & middle incomeLow incomeLower middle incomeLuxembourgMacao SAR, ChinaMacedonia, FYRMadagascarMalawiMalaysiaMaldivesMaliMaltaMarshall IslandsMauritaniaMauritiusMexicoMicronesia, Fed. Sts.Middle East & North AfricaMiddle East & North Africa (excluding high income)Middle East & North Africa (IDA & IBRD countries)Middle incomeMoldovaMongoliaMontenegroMoroccoMozambiqueMyanmarNamibiaNauruNepalNetherlandsNew ZealandNicaraguaNigerNigeriaNorth AmericaNorwayOECD membersOmanOther small statesPacific island small statesPakistanPalauPanamaPapua New GuineaParaguayPeruPhilippinesPolandPortugalPost-demographic dividendPre-demographic dividendPuerto RicoQatarRomaniaRussian FederationRwandaSamoaSao Tome and PrincipeSaudi ArabiaSenegalSerbiaSeychellesSierra LeoneSingaporeSlovak RepublicSloveniaSmall statesSolomon IslandsSouth AfricaSouth AsiaSouth Asia (IDA & IBRD)South SudanSpainSri LankaSt. Kitts and NevisSt. LuciaSt. Vincent and the GrenadinesSub-Saharan Africa Sub-Saharan Africa (excluding high income)Sub-Saharan Africa (IDA & IBRD countries)SudanSurinameSwazilandSwedenSwitzerlandTajikistanTanzaniaThailandTimor-LesteTogoTongaTrinidad and TobagoTunisiaTurkeyTurkmenistanTuvaluUgandaUkraineUnited Arab EmiratesUnited KingdomUnited StatesUpper middle incomeUruguayUzbekistanVanuatuVenezuela, RBVietnamWest Bank and GazaWorldYemen, Rep.ZambiaZimbabwe Timeline:
This timeline shows a graph from 1991 to 2016 of Europe & Central Asia (excluding high income). No data until 1990. Number of actual observations by date: 26.
Source name:
World Development Indicators
Source organization:
World Bank, International Comparison Program database.
Categories, topics:
Economy & Growth
Last updated:
apr 23, 2017
Indicators value changes by year
Minimum:
1.912 trl
jan 1, 1996
Maximum:
7.298 trl
jan 1, 2016
At the date of observation
Value
Absolute change
Change from previous value
jan 1, 1991
2.462 trl
+2.462 trl
0.0%
jan 1, 1992
2.403 trl
-59.261 bln
-2.41%
jan 1, 1993
2.191 trl
-211.749 bln
-8.81%
jan 1, 1994
2.109 trl
-82.154 bln
-3.75%
jan 1, 1995
1.918 trl
-191.46 bln
-9.08%
jan 1, 1996
1.912 trl
-5.348 bln
-0.28%
jan 1, 1997
1.94 trl
+27.509 bln
1.44%
jan 1, 1998
2.015 trl
+74.957 bln
3.86%
jan 1, 1999
2.005 trl
-10.341 bln
-0.51%
jan 1, 2000
2.068 trl
+63.898 bln
3.19%
jan 1, 2001
2.316 trl
+247.601 bln
11.97%
jan 1, 2002
2.469 trl
+153.234 bln
6.62%
jan 1, 2003
2.638 trl
+169.172 bln
6.85%
jan 1, 2004
2.899 trl
+260.643 bln
9.88%
jan 1, 2005
3.258 trl
+359.132 bln
12.39%
jan 1, 2006
3.648 trl
+389.556 bln
11.96%
jan 1, 2007
4.351 trl
+702.8 bln
19.27%
jan 1, 2008
4.861 trl
+510.122 bln
11.73%
jan 1, 2009
5.589 trl
+728.273 bln
14.98%
jan 1, 2010
5.413 trl
-175.97 bln
-3.15%
jan 1, 2011
5.831 trl
+417.517 bln
7.71%
jan 1, 2012
6.596 trl
+765.846 bln
13.14%
jan 1, 2013
6.908 trl
+311.896 bln
4.73%
jan 1, 2014
6.932 trl
+23.557 bln
0.34%
jan 1, 2015
7.276 trl
+343.798 bln
4.96%
jan 1, 2016
7.298 trl
+22.317 bln
0.31%
Ranking of countries by current statistics by years


Comments: