29
/
en
AIzaSyAYiBZKx7MnpbEhh9jyipgxe19OcubqV5w
April 1, 2024
28147
East Asia & Pacific (excluding high income)
EAP
false
2
1
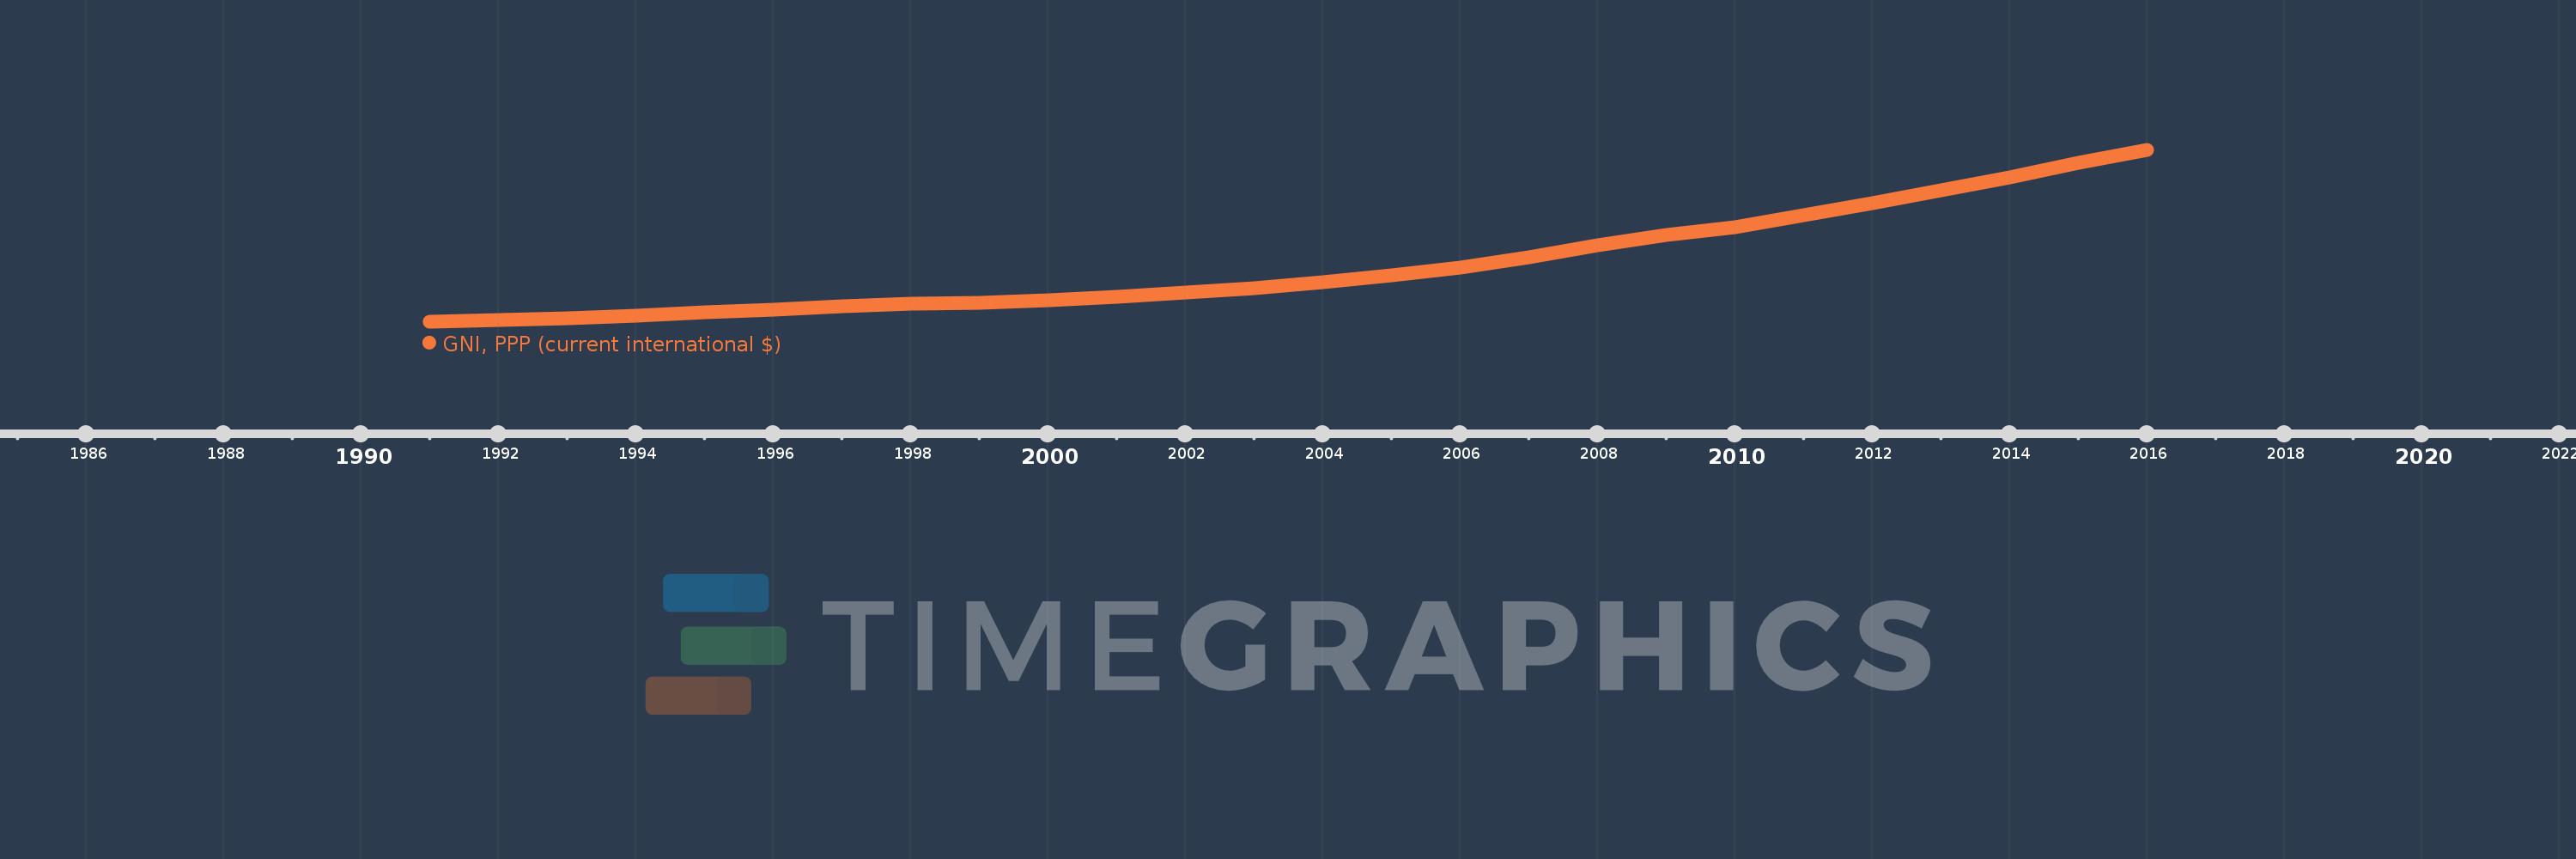
GNI, PPP (current international $)
2016,2015,2014,2013,2012,2011,2010,2009,2008,2007,2006,2005,2004,2003,2002,2001,2000,1999,1998,1997,1996,1995,1994,1993,1992,1991
This statistics in other country:
AfghanistanAlbaniaAlgeriaAngolaAntigua and BarbudaArab WorldArgentinaArmeniaAustraliaAustriaAzerbaijanBahamas, TheBahrainBangladeshBarbadosBelarusBelgiumBelizeBeninBermudaBhutanBoliviaBosnia and HerzegovinaBotswanaBrazilBrunei DarussalamBulgariaBurkina FasoBurundiCabo VerdeCambodiaCameroonCanadaCaribbean small statesCentral African RepublicCentral Europe and the BalticsChadChileChinaColombiaComorosCongo, Dem. Rep.Congo, Rep.Costa RicaCote d'IvoireCroatiaCubaCyprusCzech RepublicDenmarkDjiboutiDominicaDominican RepublicEarly-demographic dividendEast Asia & PacificEast Asia & Pacific (excluding high income)East Asia & Pacific (IDA & IBRD countries)EcuadorEgypt, Arab Rep.El SalvadorEquatorial GuineaEritreaEstoniaEthiopiaEuro areaEurope & Central AsiaEurope & Central Asia (excluding high income)Europe & Central Asia (IDA & IBRD countries)European UnionFijiFinlandFragile and conflict affected situationsFranceGabonGambia, TheGeorgiaGermanyGhanaGreeceGrenadaGuatemalaGuineaGuinea-BissauGuyanaHaitiHeavily indebted poor countries (HIPC)High incomeHondurasHong Kong SAR, ChinaHungaryIBRD onlyIcelandIDA & IBRD totalIDA blendIDA onlyIDA totalIndiaIndonesiaIran, Islamic Rep.IraqIrelandIsraelItalyJamaicaJapanJordanKazakhstanKenyaKiribatiKorea, Rep.KosovoKuwaitKyrgyz RepublicLao PDRLate-demographic dividendLatin America & Caribbean Latin America & Caribbean (excluding high income)Latin America & the Caribbean (IDA & IBRD countries)LatviaLeast developed countries: UN classificationLebanonLesothoLiberiaLibyaLithuaniaLow & middle incomeLow incomeLower middle incomeLuxembourgMacao SAR, ChinaMacedonia, FYRMadagascarMalawiMalaysiaMaldivesMaliMaltaMarshall IslandsMauritaniaMauritiusMexicoMicronesia, Fed. Sts.Middle East & North AfricaMiddle East & North Africa (excluding high income)Middle East & North Africa (IDA & IBRD countries)Middle incomeMoldovaMongoliaMontenegroMoroccoMozambiqueMyanmarNamibiaNauruNepalNetherlandsNew ZealandNicaraguaNigerNigeriaNorth AmericaNorwayOECD membersOmanOther small statesPacific island small statesPakistanPalauPanamaPapua New GuineaParaguayPeruPhilippinesPolandPortugalPost-demographic dividendPre-demographic dividendPuerto RicoQatarRomaniaRussian FederationRwandaSamoaSao Tome and PrincipeSaudi ArabiaSenegalSerbiaSeychellesSierra LeoneSingaporeSlovak RepublicSloveniaSmall statesSolomon IslandsSouth AfricaSouth AsiaSouth Asia (IDA & IBRD)South SudanSpainSri LankaSt. Kitts and NevisSt. LuciaSt. Vincent and the GrenadinesSub-Saharan Africa Sub-Saharan Africa (excluding high income)Sub-Saharan Africa (IDA & IBRD countries)SudanSurinameSwazilandSwedenSwitzerlandTajikistanTanzaniaThailandTimor-LesteTogoTongaTrinidad and TobagoTunisiaTurkeyTurkmenistanTuvaluUgandaUkraineUnited Arab EmiratesUnited KingdomUnited StatesUpper middle incomeUruguayUzbekistanVanuatuVenezuela, RBVietnamWest Bank and GazaWorldYemen, Rep.ZambiaZimbabwe Timeline:
This timeline shows a graph from 1991 to 2016 of East Asia & Pacific (excluding high income). No data until 1990. Number of actual observations by date: 26.
Source name:
World Development Indicators
Source organization:
World Bank, International Comparison Program database.
Categories, topics:
Economy & Growth
Last updated:
apr 23, 2017
Indicators value changes by year
Minimum:
2.288 trl
jan 1, 1991
Maximum:
26.239 trl
jan 1, 2016
At the date of observation
Value
Absolute change
Change from previous value
jan 1, 1991
2.288 trl
+2.288 trl
0.0%
jan 1, 1992
2.513 trl
+224.912 bln
9.83%
jan 1, 1993
2.839 trl
+326.205 bln
12.98%
jan 1, 1994
3.222 trl
+382.796 bln
13.48%
jan 1, 1995
3.648 trl
+425.528 bln
13.21%
jan 1, 1996
4.05 trl
+402.023 bln
11.02%
jan 1, 1997
4.489 trl
+439.505 bln
10.85%
jan 1, 1998
4.88 trl
+390.797 bln
8.71%
jan 1, 1999
4.958 trl
+78.148 bln
1.6%
jan 1, 2000
5.32 trl
+361.967 bln
7.3%
jan 1, 2001
5.844 trl
+523.754 bln
9.85%
jan 1, 2002
6.341 trl
+497.505 bln
8.51%
jan 1, 2003
6.938 trl
+597.172 bln
9.42%
jan 1, 2004
7.81 trl
+871.821 bln
12.57%
jan 1, 2005
8.739 trl
+928.776 bln
11.89%
jan 1, 2006
9.851 trl
+1.112 trl
12.72%
jan 1, 2007
11.272 trl
+1.421 trl
14.43%
jan 1, 2008
12.996 trl
+1.724 trl
15.29%
jan 1, 2009
14.386 trl
+1.39 trl
10.7%
jan 1, 2010
15.502 trl
+1.116 trl
7.76%
jan 1, 2011
17.166 trl
+1.664 trl
10.74%
jan 1, 2012
18.839 trl
+1.673 trl
9.75%
jan 1, 2013
20.693 trl
+1.854 trl
9.84%
jan 1, 2014
22.412 trl
+1.719 trl
8.31%
jan 1, 2015
24.499 trl
+2.087 trl
9.31%
jan 1, 2016
26.239 trl
+1.741 trl
7.1%
Ranking of countries by current statistics by years


Comments: