29
/
en
AIzaSyAYiBZKx7MnpbEhh9jyipgxe19OcubqV5w
April 1, 2024
84755
Benin
BEN
true
2
1
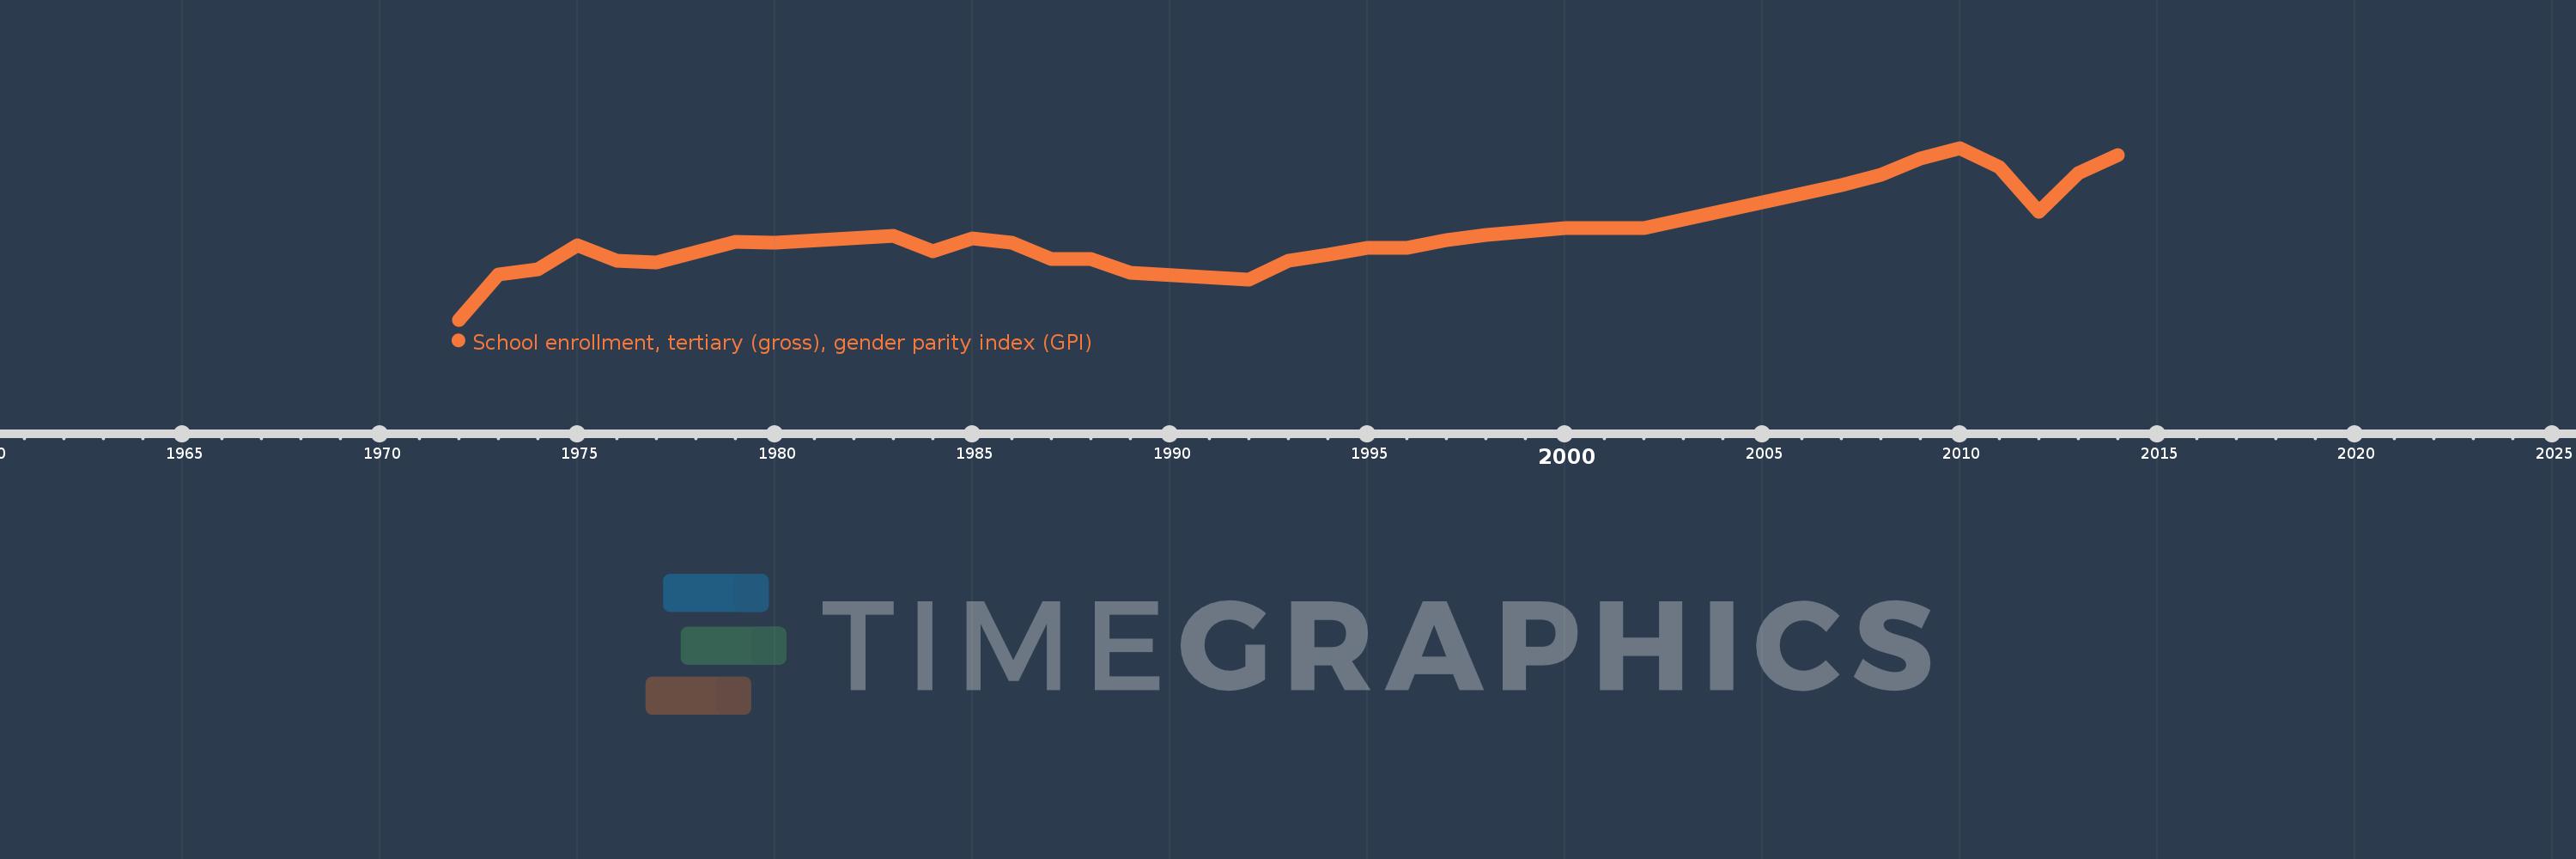
School enrollment, tertiary (gross), gender parity index (GPI)
2014,2013,2012,2011,2010,2009,2008,2007,2002,2001,2000,1998,1997,1996,1995,1994,1993,1992,1989,1988,1987,1986,1985,1984,1983,1980,1979,1977,1976,1975,1974,1973,1972
This statistics in other country:
AfghanistanAlbaniaAlgeriaAngolaAntigua and BarbudaArab WorldArgentinaArmeniaArubaAustraliaAustriaAzerbaijanBahamas, TheBahrainBangladeshBarbadosBelarusBelgiumBelizeBeninBermudaBhutanBoliviaBosnia and HerzegovinaBotswanaBrazilBrunei DarussalamBulgariaBurkina FasoBurundiCabo VerdeCambodiaCameroonCanadaCaribbean small statesCentral African RepublicCentral Europe and the BalticsChadChileChinaColombiaComorosCongo, Dem. Rep.Congo, Rep.Costa RicaCote d'IvoireCroatiaCubaCuracaoCyprusCzech RepublicDenmarkDjiboutiDominicaDominican RepublicEarly-demographic dividendEast Asia & PacificEast Asia & Pacific (excluding high income)East Asia & Pacific (IDA & IBRD countries)EcuadorEgypt, Arab Rep.El SalvadorEquatorial GuineaEritreaEstoniaEthiopiaEuro areaEurope & Central AsiaEurope & Central Asia (excluding high income)Europe & Central Asia (IDA & IBRD countries)European UnionFijiFinlandFragile and conflict affected situationsFranceGabonGambia, TheGeorgiaGermanyGhanaGreeceGrenadaGuatemalaGuineaGuinea-BissauGuyanaHaitiHeavily indebted poor countries (HIPC)High incomeHondurasHong Kong SAR, ChinaHungaryIBRD onlyIcelandIDA & IBRD totalIDA blendIDA onlyIDA totalIndiaIndonesiaIran, Islamic Rep.IraqIrelandIsraelItalyJamaicaJapanJordanKazakhstanKenyaKorea, Dem. People’s Rep.Korea, Rep.KuwaitKyrgyz RepublicLao PDRLate-demographic dividendLatin America & Caribbean Latin America & Caribbean (excluding high income)Latin America & the Caribbean (IDA & IBRD countries)LatviaLeast developed countries: UN classificationLebanonLesothoLiberiaLibyaLiechtensteinLithuaniaLow & middle incomeLow incomeLower middle incomeLuxembourgMacao SAR, ChinaMacedonia, FYRMadagascarMalawiMaldivesMaliMaltaMarshall IslandsMauritaniaMauritiusMexicoMicronesia, Fed. Sts.Middle East & North AfricaMiddle East & North Africa (excluding high income)Middle East & North Africa (IDA & IBRD countries)Middle incomeMoldovaMongoliaMontenegroMoroccoMozambiqueMyanmarNamibiaNepalNetherlandsNew ZealandNicaraguaNigerNigeriaNorth AmericaNorwayOECD membersOmanOther small statesPacific island small statesPakistanPalauPanamaPapua New GuineaParaguayPeruPhilippinesPolandPortugalPost-demographic dividendPre-demographic dividendPuerto RicoQatarRomaniaRussian FederationRwandaSamoaSan MarinoSao Tome and PrincipeSaudi ArabiaSenegalSerbiaSeychellesSierra LeoneSingaporeSlovak RepublicSloveniaSmall statesSomaliaSouth AfricaSouth AsiaSouth Asia (IDA & IBRD)SpainSri LankaSt. Kitts and NevisSt. LuciaSt. Vincent and the GrenadinesSub-Saharan Africa Sub-Saharan Africa (excluding high income)Sub-Saharan Africa (IDA & IBRD countries)SudanSurinameSwazilandSwedenSwitzerlandSyrian Arab RepublicTajikistanTanzaniaThailandTimor-LesteTogoTongaTrinidad and TobagoTunisiaTurkeyTurkmenistanUgandaUkraineUnited Arab EmiratesUnited KingdomUnited StatesUpper middle incomeUruguayUzbekistanVanuatuVenezuela, RBVietnamWest Bank and GazaWorldYemen, Rep.ZambiaZimbabwe Timeline:
This timeline shows a graph from 1972 to 2014 of Benin. No data until 1971. Number of actual observations by date: 33.
Source name:
World Development Indicators
Source organization:
United Nations Educational, Scientific, and Cultural Organization (UNESCO) Institute for Statistics.
Categories, topics:
Education, Gender, Social Development
Last updated:
apr 23, 2017
Indicators value changes by year
At the date of observation
Value
Absolute change
Change from previous value
jan 1, 1972
0.071
+0.071
0.0%
jan 1, 1973
0.155
+0.084
117.4%
jan 1, 1974
0.164
+0.009
5.58%
jan 1, 1975
0.208
+0.044
26.78%
jan 1, 1976
0.179
-0.029
-14.03%
jan 1, 1977
0.176
-0.003
-1.72%
jan 1, 1979
0.215
+0.039
22.17%
jan 1, 1980
0.213
-0.002
-0.73%
jan 1, 1983
0.226
+0.013
6.19%
jan 1, 1984
0.197
-0.03
-13.09%
jan 1, 1985
0.22
+0.023
11.83%
jan 1, 1986
0.212
-0.008
-3.62%
jan 1, 1987
0.183
-0.029
-13.81%
jan 1, 1988
0.182
0.0
-0.24%
jan 1, 1989
0.157
-0.025
-13.62%
jan 1, 1992
0.145
-0.013
-8.1%
jan 1, 1993
0.179
+0.034
23.75%
jan 1, 1994
0.19
+0.011
6.33%
jan 1, 1995
0.204
+0.014
7.19%
jan 1, 1996
0.204
+0.0
0.21%
jan 1, 1997
0.218
+0.014
6.75%
jan 1, 1998
0.227
+0.009
4.07%
jan 1, 2000
0.24
+0.013
5.73%
jan 1, 2001
0.24
0.0
-0.05%
jan 1, 2002
0.24
+0.0
0.17%
jan 1, 2007
0.319
+0.079
32.68%
jan 1, 2008
0.337
+0.018
5.7%
jan 1, 2009
0.368
+0.031
9.24%
jan 1, 2010
0.387
+0.019
5.12%
jan 1, 2011
0.351
-0.036
-9.42%
jan 1, 2012
0.27
-0.081
-23.13%
jan 1, 2013
0.341
+0.071
26.39%
jan 1, 2014
0.374
+0.034
9.84%
Ranking of countries by current statistics by years


Comments: