29
/
en
AIzaSyAYiBZKx7MnpbEhh9jyipgxe19OcubqV5w
April 1, 2024
38575
IDA blend
IDB
false
2
1
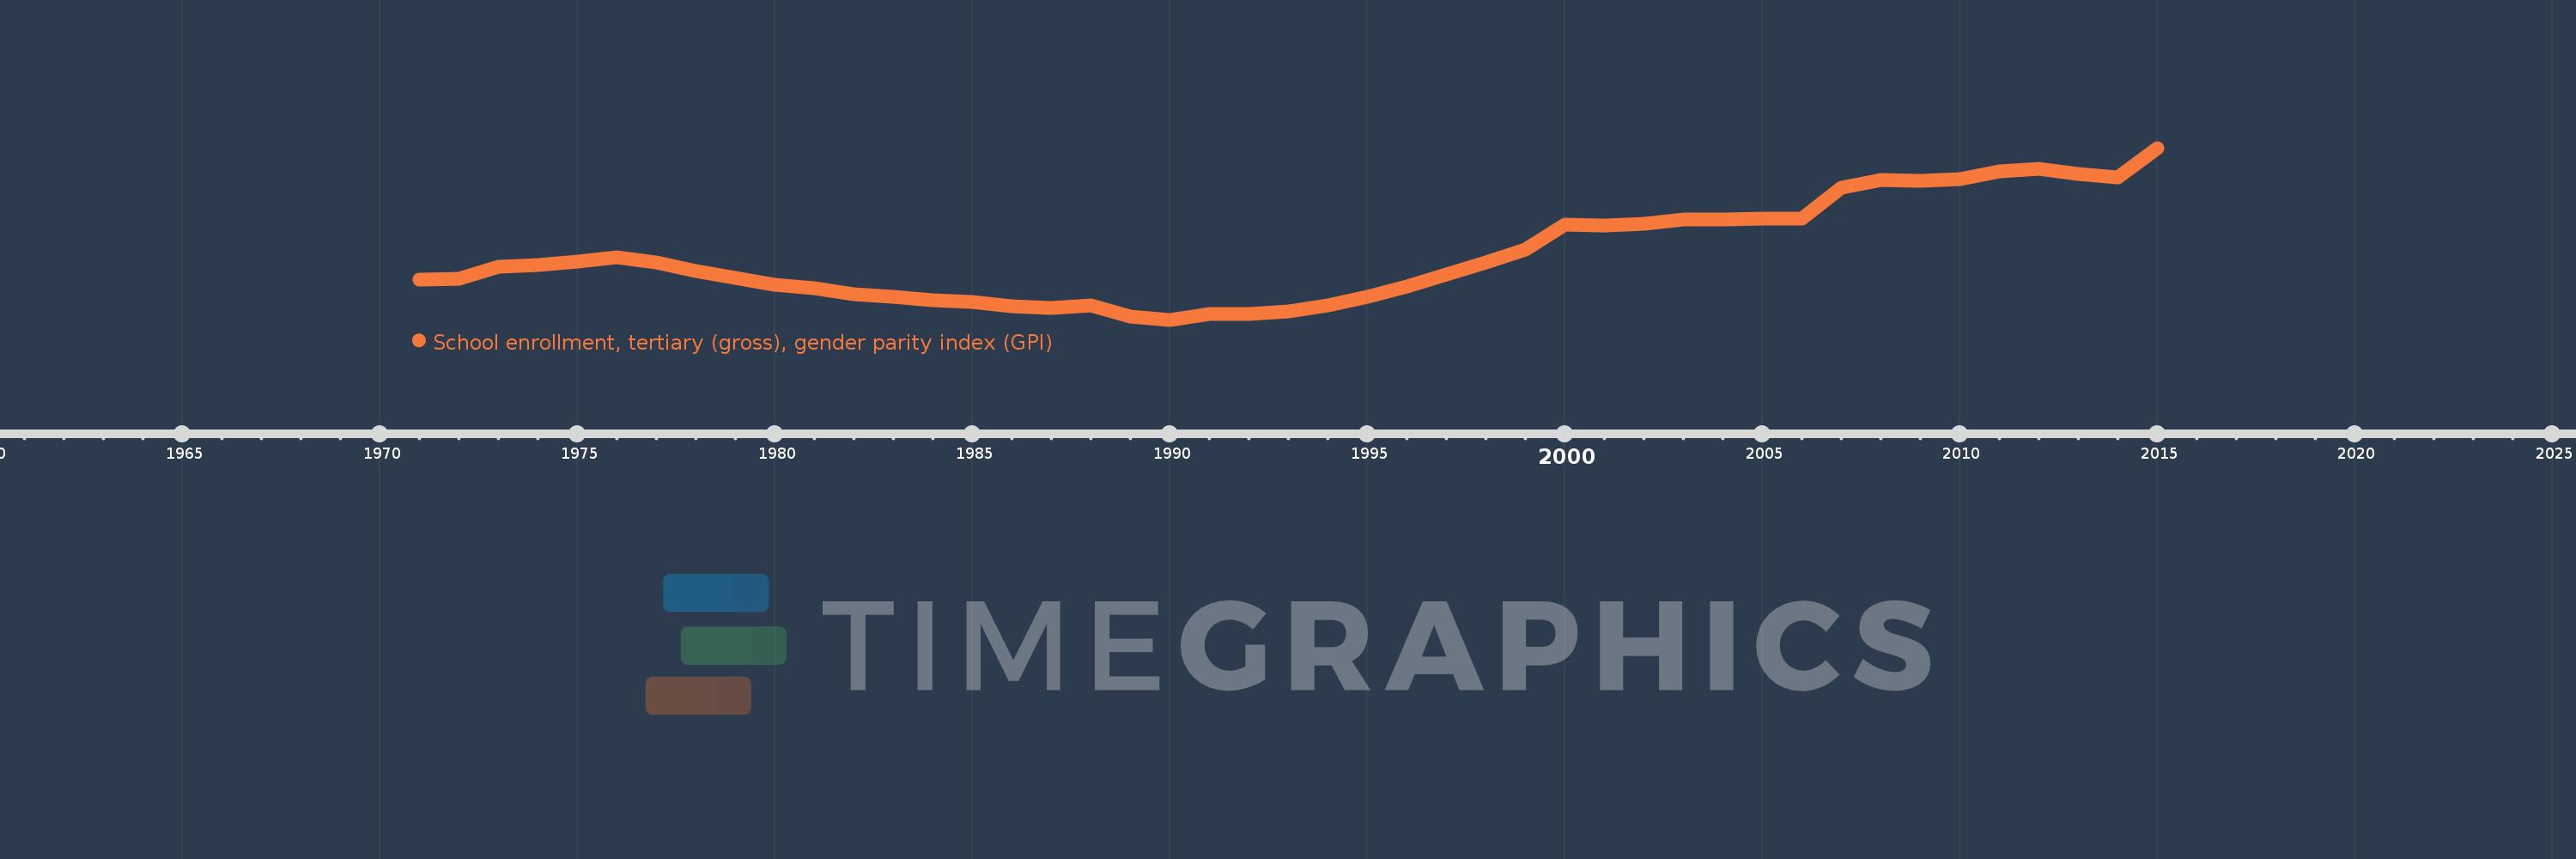
School enrollment, tertiary (gross), gender parity index (GPI)
2015,2014,2013,2012,2011,2010,2009,2008,2007,2006,2005,2004,2003,2002,2001,2000,1999,1998,1997,1996,1995,1994,1993,1992,1991,1990,1989,1988,1987,1986,1985,1984,1983,1982,1981,1980,1979,1978,1977,1976,1975,1974,1973,1972,1971
This statistics in other country:
AfghanistanAlbaniaAlgeriaAngolaAntigua and BarbudaArab WorldArgentinaArmeniaArubaAustraliaAustriaAzerbaijanBahamas, TheBahrainBangladeshBarbadosBelarusBelgiumBelizeBeninBermudaBhutanBoliviaBosnia and HerzegovinaBotswanaBrazilBrunei DarussalamBulgariaBurkina FasoBurundiCabo VerdeCambodiaCameroonCanadaCaribbean small statesCentral African RepublicCentral Europe and the BalticsChadChileChinaColombiaComorosCongo, Dem. Rep.Congo, Rep.Costa RicaCote d'IvoireCroatiaCubaCuracaoCyprusCzech RepublicDenmarkDjiboutiDominicaDominican RepublicEarly-demographic dividendEast Asia & PacificEast Asia & Pacific (excluding high income)East Asia & Pacific (IDA & IBRD countries)EcuadorEgypt, Arab Rep.El SalvadorEquatorial GuineaEritreaEstoniaEthiopiaEuro areaEurope & Central AsiaEurope & Central Asia (excluding high income)Europe & Central Asia (IDA & IBRD countries)European UnionFijiFinlandFragile and conflict affected situationsFranceGabonGambia, TheGeorgiaGermanyGhanaGreeceGrenadaGuatemalaGuineaGuinea-BissauGuyanaHaitiHeavily indebted poor countries (HIPC)High incomeHondurasHong Kong SAR, ChinaHungaryIBRD onlyIcelandIDA & IBRD totalIDA blendIDA onlyIDA totalIndiaIndonesiaIran, Islamic Rep.IraqIrelandIsraelItalyJamaicaJapanJordanKazakhstanKenyaKorea, Dem. People’s Rep.Korea, Rep.KuwaitKyrgyz RepublicLao PDRLate-demographic dividendLatin America & Caribbean Latin America & Caribbean (excluding high income)Latin America & the Caribbean (IDA & IBRD countries)LatviaLeast developed countries: UN classificationLebanonLesothoLiberiaLibyaLiechtensteinLithuaniaLow & middle incomeLow incomeLower middle incomeLuxembourgMacao SAR, ChinaMacedonia, FYRMadagascarMalawiMaldivesMaliMaltaMarshall IslandsMauritaniaMauritiusMexicoMicronesia, Fed. Sts.Middle East & North AfricaMiddle East & North Africa (excluding high income)Middle East & North Africa (IDA & IBRD countries)Middle incomeMoldovaMongoliaMontenegroMoroccoMozambiqueMyanmarNamibiaNepalNetherlandsNew ZealandNicaraguaNigerNigeriaNorth AmericaNorwayOECD membersOmanOther small statesPacific island small statesPakistanPalauPanamaPapua New GuineaParaguayPeruPhilippinesPolandPortugalPost-demographic dividendPre-demographic dividendPuerto RicoQatarRomaniaRussian FederationRwandaSamoaSan MarinoSao Tome and PrincipeSaudi ArabiaSenegalSerbiaSeychellesSierra LeoneSingaporeSlovak RepublicSloveniaSmall statesSomaliaSouth AfricaSouth AsiaSouth Asia (IDA & IBRD)SpainSri LankaSt. Kitts and NevisSt. LuciaSt. Vincent and the GrenadinesSub-Saharan Africa Sub-Saharan Africa (excluding high income)Sub-Saharan Africa (IDA & IBRD countries)SudanSurinameSwazilandSwedenSwitzerlandSyrian Arab RepublicTajikistanTanzaniaThailandTimor-LesteTogoTongaTrinidad and TobagoTunisiaTurkeyTurkmenistanUgandaUkraineUnited Arab EmiratesUnited KingdomUnited StatesUpper middle incomeUruguayUzbekistanVanuatuVenezuela, RBVietnamWest Bank and GazaWorldYemen, Rep.ZambiaZimbabwe Timeline:
This timeline shows a graph from 1971 to 2015 of IDA blend. No data until 1970. Number of actual observations by date: 45.
Source name:
World Development Indicators
Source organization:
United Nations Educational, Scientific, and Cultural Organization (UNESCO) Institute for Statistics.
Categories, topics:
Education, Gender, Social Development
Last updated:
apr 23, 2017
Indicators value changes by year
At the date of observation
Value
Absolute change
Change from previous value
jan 1, 1971
0.657
+0.657
0.0%
jan 1, 1972
0.66
+0.003
0.46%
jan 1, 1973
0.687
+0.027
4.13%
jan 1, 1974
0.69
+0.003
0.42%
jan 1, 1975
0.698
+0.008
1.15%
jan 1, 1976
0.708
+0.01
1.44%
jan 1, 1977
0.697
-0.011
-1.51%
jan 1, 1978
0.678
-0.019
-2.75%
jan 1, 1979
0.661
-0.017
-2.47%
jan 1, 1980
0.647
-0.015
-2.2%
jan 1, 1981
0.638
-0.009
-1.42%
jan 1, 1982
0.625
-0.013
-2.02%
jan 1, 1983
0.618
-0.007
-1.11%
jan 1, 1984
0.612
-0.005
-0.88%
jan 1, 1985
0.607
-0.005
-0.85%
jan 1, 1986
0.598
-0.01
-1.59%
jan 1, 1987
0.594
-0.004
-0.59%
jan 1, 1988
0.599
+0.005
0.84%
jan 1, 1989
0.575
-0.024
-4.05%
jan 1, 1990
0.567
-0.008
-1.32%
jan 1, 1991
0.58
+0.012
2.2%
jan 1, 1992
0.58
+0.001
0.14%
jan 1, 1993
0.585
+0.004
0.75%
jan 1, 1994
0.599
+0.014
2.36%
jan 1, 1995
0.618
+0.019
3.25%
jan 1, 1996
0.643
+0.025
3.97%
jan 1, 1997
0.67
+0.027
4.22%
jan 1, 1998
0.696
+0.026
3.92%
jan 1, 1999
0.725
+0.029
4.13%
jan 1, 2000
0.782
+0.058
7.98%
jan 1, 2001
0.78
-0.002
-0.29%
jan 1, 2002
0.784
+0.004
0.54%
jan 1, 2003
0.794
+0.009
1.17%
jan 1, 2004
0.794
+0.001
0.09%
jan 1, 2005
0.795
+0.001
0.14%
jan 1, 2006
0.795
0.0
-0.01%
jan 1, 2007
0.866
+0.071
8.86%
jan 1, 2008
0.883
+0.017
2.01%
jan 1, 2009
0.881
-0.003
-0.29%
jan 1, 2010
0.886
+0.005
0.54%
jan 1, 2011
0.902
+0.017
1.88%
jan 1, 2012
0.908
+0.006
0.62%
jan 1, 2013
0.898
-0.01
-1.05%
jan 1, 2014
0.89
-0.008
-0.93%
jan 1, 2015
0.956
+0.066
7.38%
Ranking of countries by current statistics by years


Comments: