29
/
en
AIzaSyAYiBZKx7MnpbEhh9jyipgxe19OcubqV5w
April 1, 2024
131155
Ethiopia
ETH
true
2
1
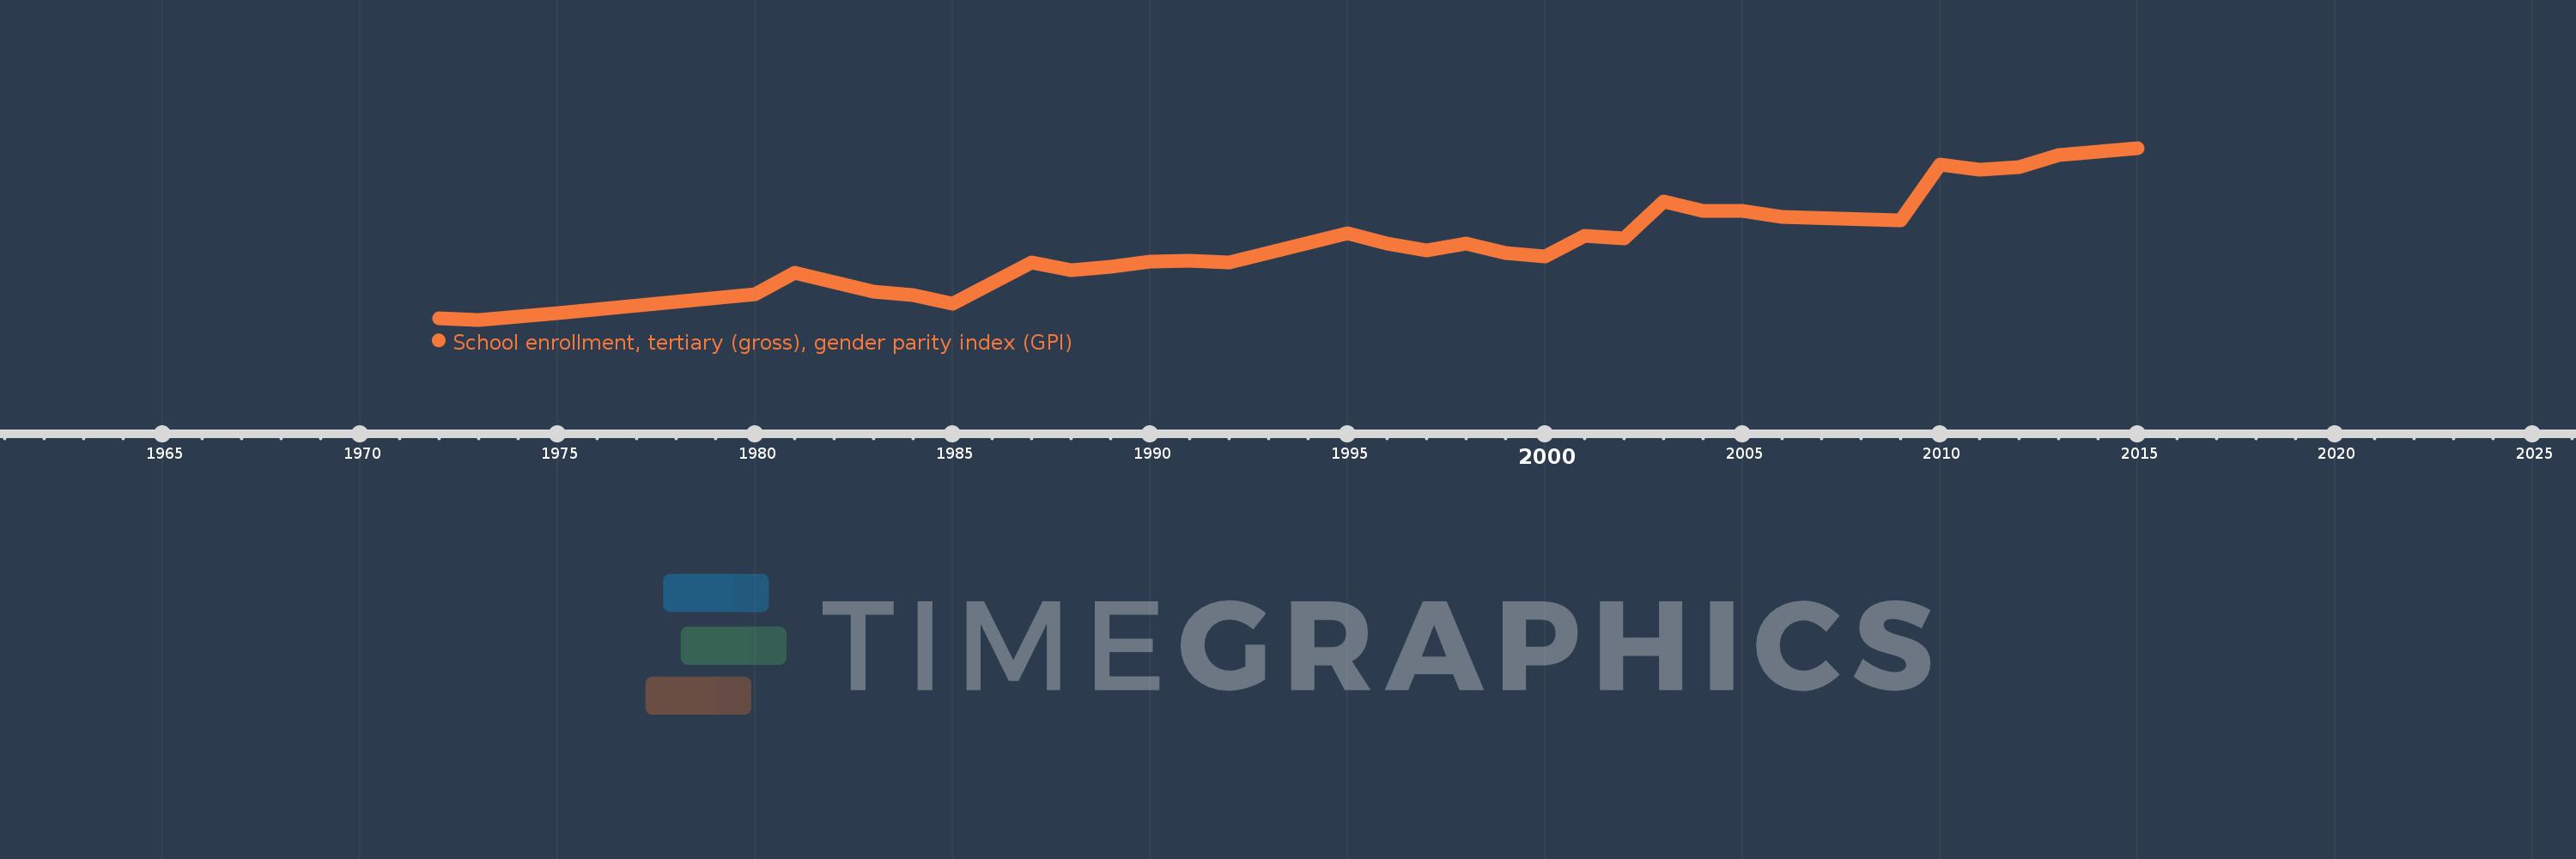
School enrollment, tertiary (gross), gender parity index (GPI)
2015,2013,2012,2011,2010,2009,2006,2005,2004,2003,2002,2001,2000,1999,1998,1997,1996,1995,1992,1991,1990,1989,1988,1987,1985,1984,1983,1981,1980,1975,1973,1972
This statistics in other country:
AfghanistanAlbaniaAlgeriaAngolaAntigua and BarbudaArab WorldArgentinaArmeniaArubaAustraliaAustriaAzerbaijanBahamas, TheBahrainBangladeshBarbadosBelarusBelgiumBelizeBeninBermudaBhutanBoliviaBosnia and HerzegovinaBotswanaBrazilBrunei DarussalamBulgariaBurkina FasoBurundiCabo VerdeCambodiaCameroonCanadaCaribbean small statesCentral African RepublicCentral Europe and the BalticsChadChileChinaColombiaComorosCongo, Dem. Rep.Congo, Rep.Costa RicaCote d'IvoireCroatiaCubaCuracaoCyprusCzech RepublicDenmarkDjiboutiDominicaDominican RepublicEarly-demographic dividendEast Asia & PacificEast Asia & Pacific (excluding high income)East Asia & Pacific (IDA & IBRD countries)EcuadorEgypt, Arab Rep.El SalvadorEquatorial GuineaEritreaEstoniaEthiopiaEuro areaEurope & Central AsiaEurope & Central Asia (excluding high income)Europe & Central Asia (IDA & IBRD countries)European UnionFijiFinlandFragile and conflict affected situationsFranceGabonGambia, TheGeorgiaGermanyGhanaGreeceGrenadaGuatemalaGuineaGuinea-BissauGuyanaHaitiHeavily indebted poor countries (HIPC)High incomeHondurasHong Kong SAR, ChinaHungaryIBRD onlyIcelandIDA & IBRD totalIDA blendIDA onlyIDA totalIndiaIndonesiaIran, Islamic Rep.IraqIrelandIsraelItalyJamaicaJapanJordanKazakhstanKenyaKorea, Dem. People’s Rep.Korea, Rep.KuwaitKyrgyz RepublicLao PDRLate-demographic dividendLatin America & Caribbean Latin America & Caribbean (excluding high income)Latin America & the Caribbean (IDA & IBRD countries)LatviaLeast developed countries: UN classificationLebanonLesothoLiberiaLibyaLiechtensteinLithuaniaLow & middle incomeLow incomeLower middle incomeLuxembourgMacao SAR, ChinaMacedonia, FYRMadagascarMalawiMaldivesMaliMaltaMarshall IslandsMauritaniaMauritiusMexicoMicronesia, Fed. Sts.Middle East & North AfricaMiddle East & North Africa (excluding high income)Middle East & North Africa (IDA & IBRD countries)Middle incomeMoldovaMongoliaMontenegroMoroccoMozambiqueMyanmarNamibiaNepalNetherlandsNew ZealandNicaraguaNigerNigeriaNorth AmericaNorwayOECD membersOmanOther small statesPacific island small statesPakistanPalauPanamaPapua New GuineaParaguayPeruPhilippinesPolandPortugalPost-demographic dividendPre-demographic dividendPuerto RicoQatarRomaniaRussian FederationRwandaSamoaSan MarinoSao Tome and PrincipeSaudi ArabiaSenegalSerbiaSeychellesSierra LeoneSingaporeSlovak RepublicSloveniaSmall statesSomaliaSouth AfricaSouth AsiaSouth Asia (IDA & IBRD)SpainSri LankaSt. Kitts and NevisSt. LuciaSt. Vincent and the GrenadinesSub-Saharan Africa Sub-Saharan Africa (excluding high income)Sub-Saharan Africa (IDA & IBRD countries)SudanSurinameSwazilandSwedenSwitzerlandSyrian Arab RepublicTajikistanTanzaniaThailandTimor-LesteTogoTongaTrinidad and TobagoTunisiaTurkeyTurkmenistanUgandaUkraineUnited Arab EmiratesUnited KingdomUnited StatesUpper middle incomeUruguayUzbekistanVanuatuVenezuela, RBVietnamWest Bank and GazaWorldYemen, Rep.ZambiaZimbabwe Timeline:
This timeline shows a graph from 1972 to 2015 of Ethiopia. No data until 1971. Number of actual observations by date: 32.
Source name:
World Development Indicators
Source organization:
United Nations Educational, Scientific, and Cultural Organization (UNESCO) Institute for Statistics.
Categories, topics:
Education, Gender, Social Development
Last updated:
apr 23, 2017
Indicators value changes by year
At the date of observation
Value
Absolute change
Change from previous value
jan 1, 1972
0.086
+0.086
0.0%
jan 1, 1973
0.082
-0.004
-4.37%
jan 1, 1975
0.098
+0.016
19.92%
jan 1, 1980
0.142
+0.043
44.26%
jan 1, 1981
0.192
+0.05
35.56%
jan 1, 1983
0.148
-0.044
-22.7%
jan 1, 1984
0.139
-0.01
-6.63%
jan 1, 1985
0.12
-0.018
-13.05%
jan 1, 1987
0.215
+0.095
78.93%
jan 1, 1988
0.197
-0.018
-8.53%
jan 1, 1989
0.206
+0.009
4.48%
jan 1, 1990
0.218
+0.012
6.06%
jan 1, 1991
0.219
+0.001
0.33%
jan 1, 1992
0.216
-0.003
-1.39%
jan 1, 1995
0.283
+0.067
31.04%
jan 1, 1996
0.258
-0.025
-8.88%
jan 1, 1997
0.242
-0.016
-6.24%
jan 1, 1998
0.258
+0.016
6.55%
jan 1, 1999
0.238
-0.019
-7.56%
jan 1, 2000
0.23
-0.008
-3.54%
jan 1, 2001
0.276
+0.046
19.97%
jan 1, 2002
0.271
-0.005
-1.82%
jan 1, 2003
0.357
+0.086
31.79%
jan 1, 2004
0.335
-0.022
-6.17%
jan 1, 2005
0.335
0.0
-0.01%
jan 1, 2006
0.321
-0.014
-4.14%
jan 1, 2009
0.312
-0.009
-2.77%
jan 1, 2010
0.442
+0.13
41.81%
jan 1, 2011
0.43
-0.012
-2.72%
jan 1, 2012
0.437
+0.007
1.57%
jan 1, 2013
0.465
+0.028
6.36%
jan 1, 2015
0.481
+0.017
3.56%
Ranking of countries by current statistics by years


Comments: