29
/
en
AIzaSyAYiBZKx7MnpbEhh9jyipgxe19OcubqV5w
April 1, 2024
53793
Other small states
OSS
false
2
1
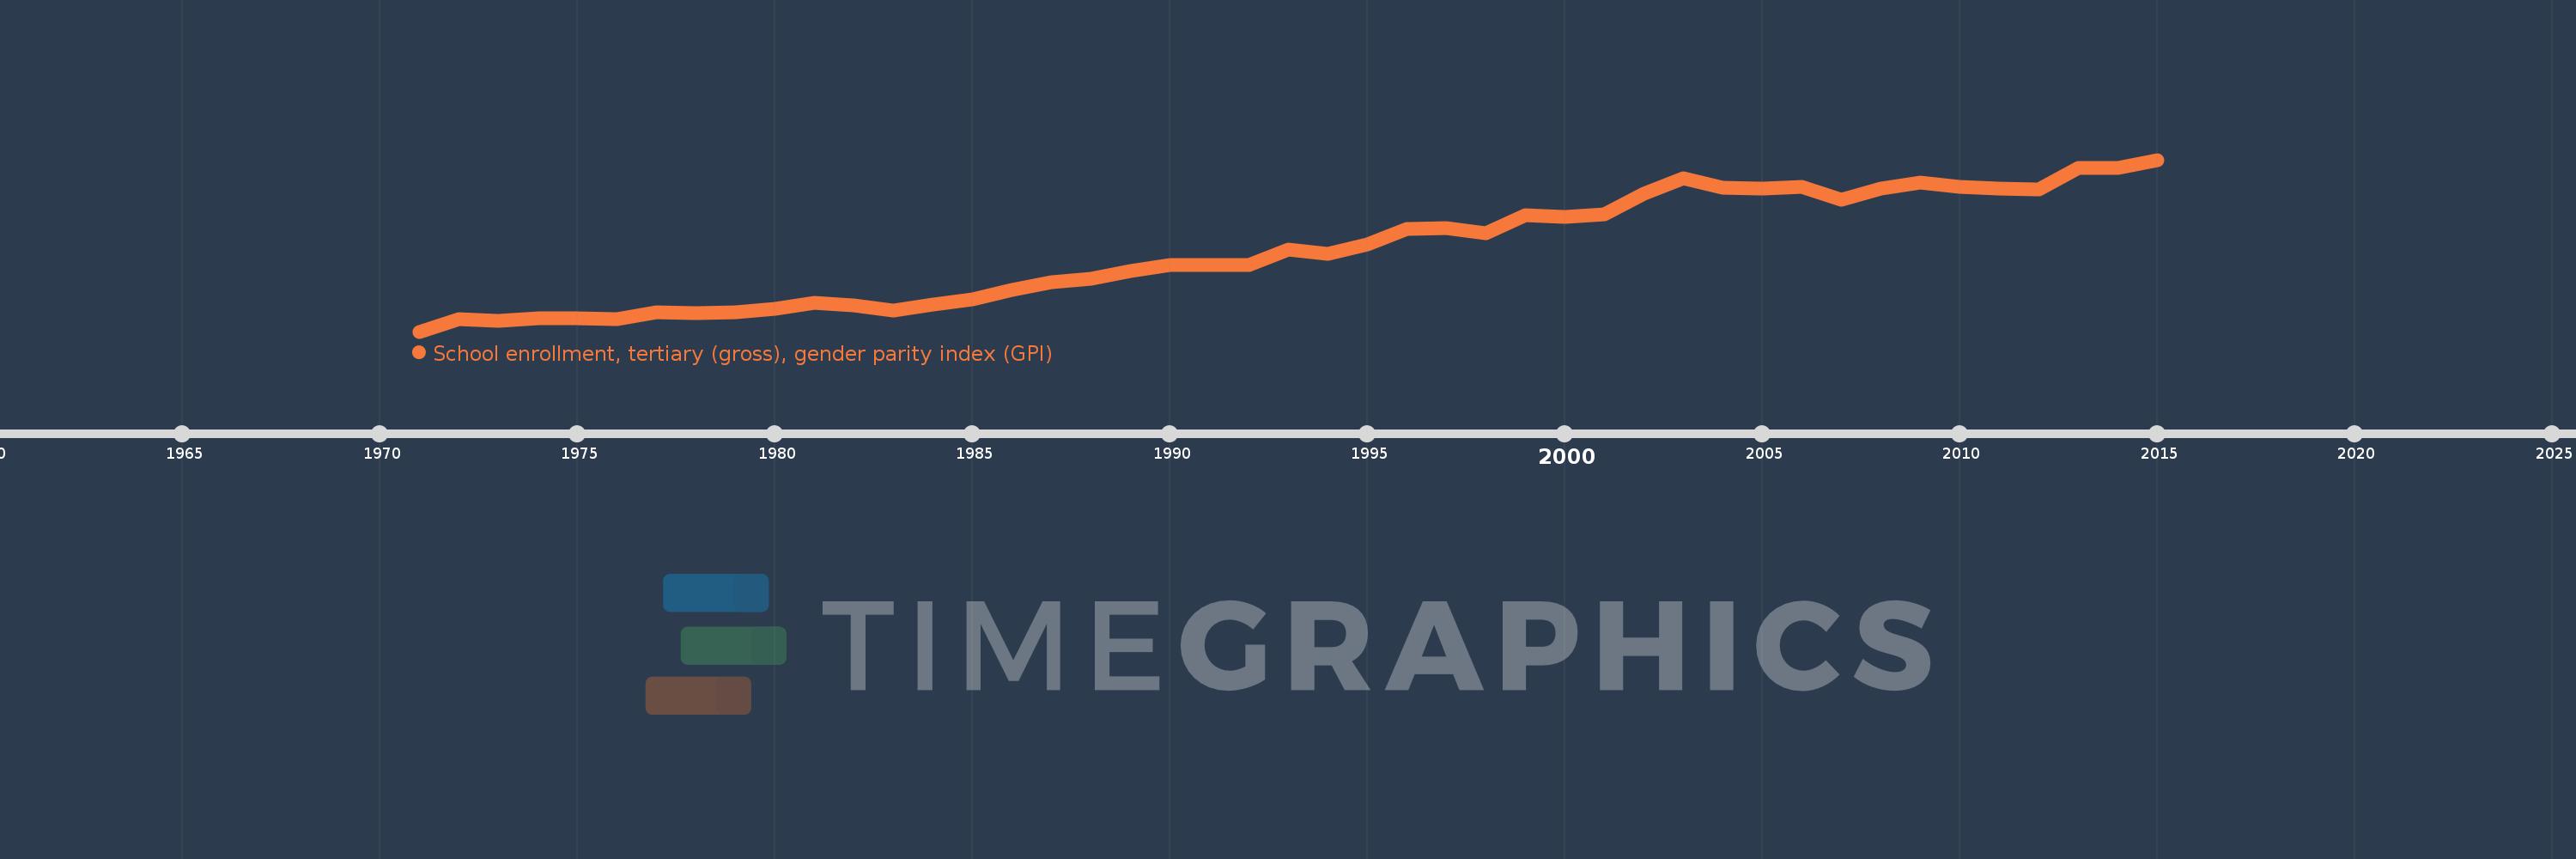
School enrollment, tertiary (gross), gender parity index (GPI)
2015,2014,2013,2012,2011,2010,2009,2008,2007,2006,2005,2004,2003,2002,2001,2000,1999,1998,1997,1996,1995,1994,1993,1992,1991,1990,1989,1988,1987,1986,1985,1984,1983,1982,1981,1980,1979,1978,1977,1976,1975,1974,1973,1972,1971
This statistics in other country:
AfghanistanAlbaniaAlgeriaAngolaAntigua and BarbudaArab WorldArgentinaArmeniaArubaAustraliaAustriaAzerbaijanBahamas, TheBahrainBangladeshBarbadosBelarusBelgiumBelizeBeninBermudaBhutanBoliviaBosnia and HerzegovinaBotswanaBrazilBrunei DarussalamBulgariaBurkina FasoBurundiCabo VerdeCambodiaCameroonCanadaCaribbean small statesCentral African RepublicCentral Europe and the BalticsChadChileChinaColombiaComorosCongo, Dem. Rep.Congo, Rep.Costa RicaCote d'IvoireCroatiaCubaCuracaoCyprusCzech RepublicDenmarkDjiboutiDominicaDominican RepublicEarly-demographic dividendEast Asia & PacificEast Asia & Pacific (excluding high income)East Asia & Pacific (IDA & IBRD countries)EcuadorEgypt, Arab Rep.El SalvadorEquatorial GuineaEritreaEstoniaEthiopiaEuro areaEurope & Central AsiaEurope & Central Asia (excluding high income)Europe & Central Asia (IDA & IBRD countries)European UnionFijiFinlandFragile and conflict affected situationsFranceGabonGambia, TheGeorgiaGermanyGhanaGreeceGrenadaGuatemalaGuineaGuinea-BissauGuyanaHaitiHeavily indebted poor countries (HIPC)High incomeHondurasHong Kong SAR, ChinaHungaryIBRD onlyIcelandIDA & IBRD totalIDA blendIDA onlyIDA totalIndiaIndonesiaIran, Islamic Rep.IraqIrelandIsraelItalyJamaicaJapanJordanKazakhstanKenyaKorea, Dem. People’s Rep.Korea, Rep.KuwaitKyrgyz RepublicLao PDRLate-demographic dividendLatin America & Caribbean Latin America & Caribbean (excluding high income)Latin America & the Caribbean (IDA & IBRD countries)LatviaLeast developed countries: UN classificationLebanonLesothoLiberiaLibyaLiechtensteinLithuaniaLow & middle incomeLow incomeLower middle incomeLuxembourgMacao SAR, ChinaMacedonia, FYRMadagascarMalawiMaldivesMaliMaltaMarshall IslandsMauritaniaMauritiusMexicoMicronesia, Fed. Sts.Middle East & North AfricaMiddle East & North Africa (excluding high income)Middle East & North Africa (IDA & IBRD countries)Middle incomeMoldovaMongoliaMontenegroMoroccoMozambiqueMyanmarNamibiaNepalNetherlandsNew ZealandNicaraguaNigerNigeriaNorth AmericaNorwayOECD membersOmanOther small statesPacific island small statesPakistanPalauPanamaPapua New GuineaParaguayPeruPhilippinesPolandPortugalPost-demographic dividendPre-demographic dividendPuerto RicoQatarRomaniaRussian FederationRwandaSamoaSan MarinoSao Tome and PrincipeSaudi ArabiaSenegalSerbiaSeychellesSierra LeoneSingaporeSlovak RepublicSloveniaSmall statesSomaliaSouth AfricaSouth AsiaSouth Asia (IDA & IBRD)SpainSri LankaSt. Kitts and NevisSt. LuciaSt. Vincent and the GrenadinesSub-Saharan Africa Sub-Saharan Africa (excluding high income)Sub-Saharan Africa (IDA & IBRD countries)SudanSurinameSwazilandSwedenSwitzerlandSyrian Arab RepublicTajikistanTanzaniaThailandTimor-LesteTogoTongaTrinidad and TobagoTunisiaTurkeyTurkmenistanUgandaUkraineUnited Arab EmiratesUnited KingdomUnited StatesUpper middle incomeUruguayUzbekistanVanuatuVenezuela, RBVietnamWest Bank and GazaWorldYemen, Rep.ZambiaZimbabwe Timeline:
This timeline shows a graph from 1971 to 2015 of Other small states. No data until 1970. Number of actual observations by date: 45.
Source name:
World Development Indicators
Source organization:
United Nations Educational, Scientific, and Cultural Organization (UNESCO) Institute for Statistics.
Categories, topics:
Education, Gender, Social Development
Last updated:
apr 23, 2017
Indicators value changes by year
At the date of observation
Value
Absolute change
Change from previous value
jan 1, 1971
0.875
+0.875
0.0%
jan 1, 1972
0.911
+0.037
4.21%
jan 1, 1973
0.904
-0.008
-0.84%
jan 1, 1974
0.913
+0.009
1.01%
jan 1, 1975
0.913
+0.0
0.01%
jan 1, 1976
0.911
-0.002
-0.25%
jan 1, 1977
0.929
+0.018
1.98%
jan 1, 1978
0.926
-0.003
-0.28%
jan 1, 1979
0.93
+0.003
0.37%
jan 1, 1980
0.938
+0.009
0.92%
jan 1, 1981
0.956
+0.018
1.9%
jan 1, 1982
0.948
-0.008
-0.87%
jan 1, 1983
0.935
-0.013
-1.36%
jan 1, 1984
0.95
+0.015
1.57%
jan 1, 1985
0.965
+0.016
1.65%
jan 1, 1986
0.993
+0.028
2.89%
jan 1, 1987
1.015
+0.022
2.21%
jan 1, 1988
1.023
+0.008
0.82%
jan 1, 1989
1.046
+0.022
2.16%
jan 1, 1990
1.062
+0.016
1.53%
jan 1, 1991
1.063
+0.001
0.14%
jan 1, 1992
1.061
-0.002
-0.2%
jan 1, 1993
1.105
+0.044
4.15%
jan 1, 1994
1.093
-0.012
-1.08%
jan 1, 1995
1.119
+0.026
2.36%
jan 1, 1996
1.163
+0.044
3.92%
jan 1, 1997
1.165
+0.003
0.22%
jan 1, 1998
1.152
-0.013
-1.14%
jan 1, 1999
1.203
+0.051
4.47%
jan 1, 2000
1.197
-0.007
-0.57%
jan 1, 2001
1.205
+0.009
0.73%
jan 1, 2002
1.263
+0.057
4.76%
jan 1, 2003
1.307
+0.044
3.47%
jan 1, 2004
1.279
-0.027
-2.08%
jan 1, 2005
1.276
-0.004
-0.29%
jan 1, 2006
1.281
+0.006
0.44%
jan 1, 2007
1.245
-0.036
-2.84%
jan 1, 2008
1.277
+0.032
2.58%
jan 1, 2009
1.294
+0.016
1.29%
jan 1, 2010
1.282
-0.012
-0.91%
jan 1, 2011
1.277
-0.005
-0.39%
jan 1, 2012
1.275
-0.002
-0.14%
jan 1, 2013
1.335
+0.06
4.74%
jan 1, 2014
1.336
+0.001
0.05%
jan 1, 2015
1.358
+0.023
1.68%
Ranking of countries by current statistics by years


Comments: