29
/
en
AIzaSyAYiBZKx7MnpbEhh9jyipgxe19OcubqV5w
April 1, 2024
178278
Lesotho
LSO
true
2
1
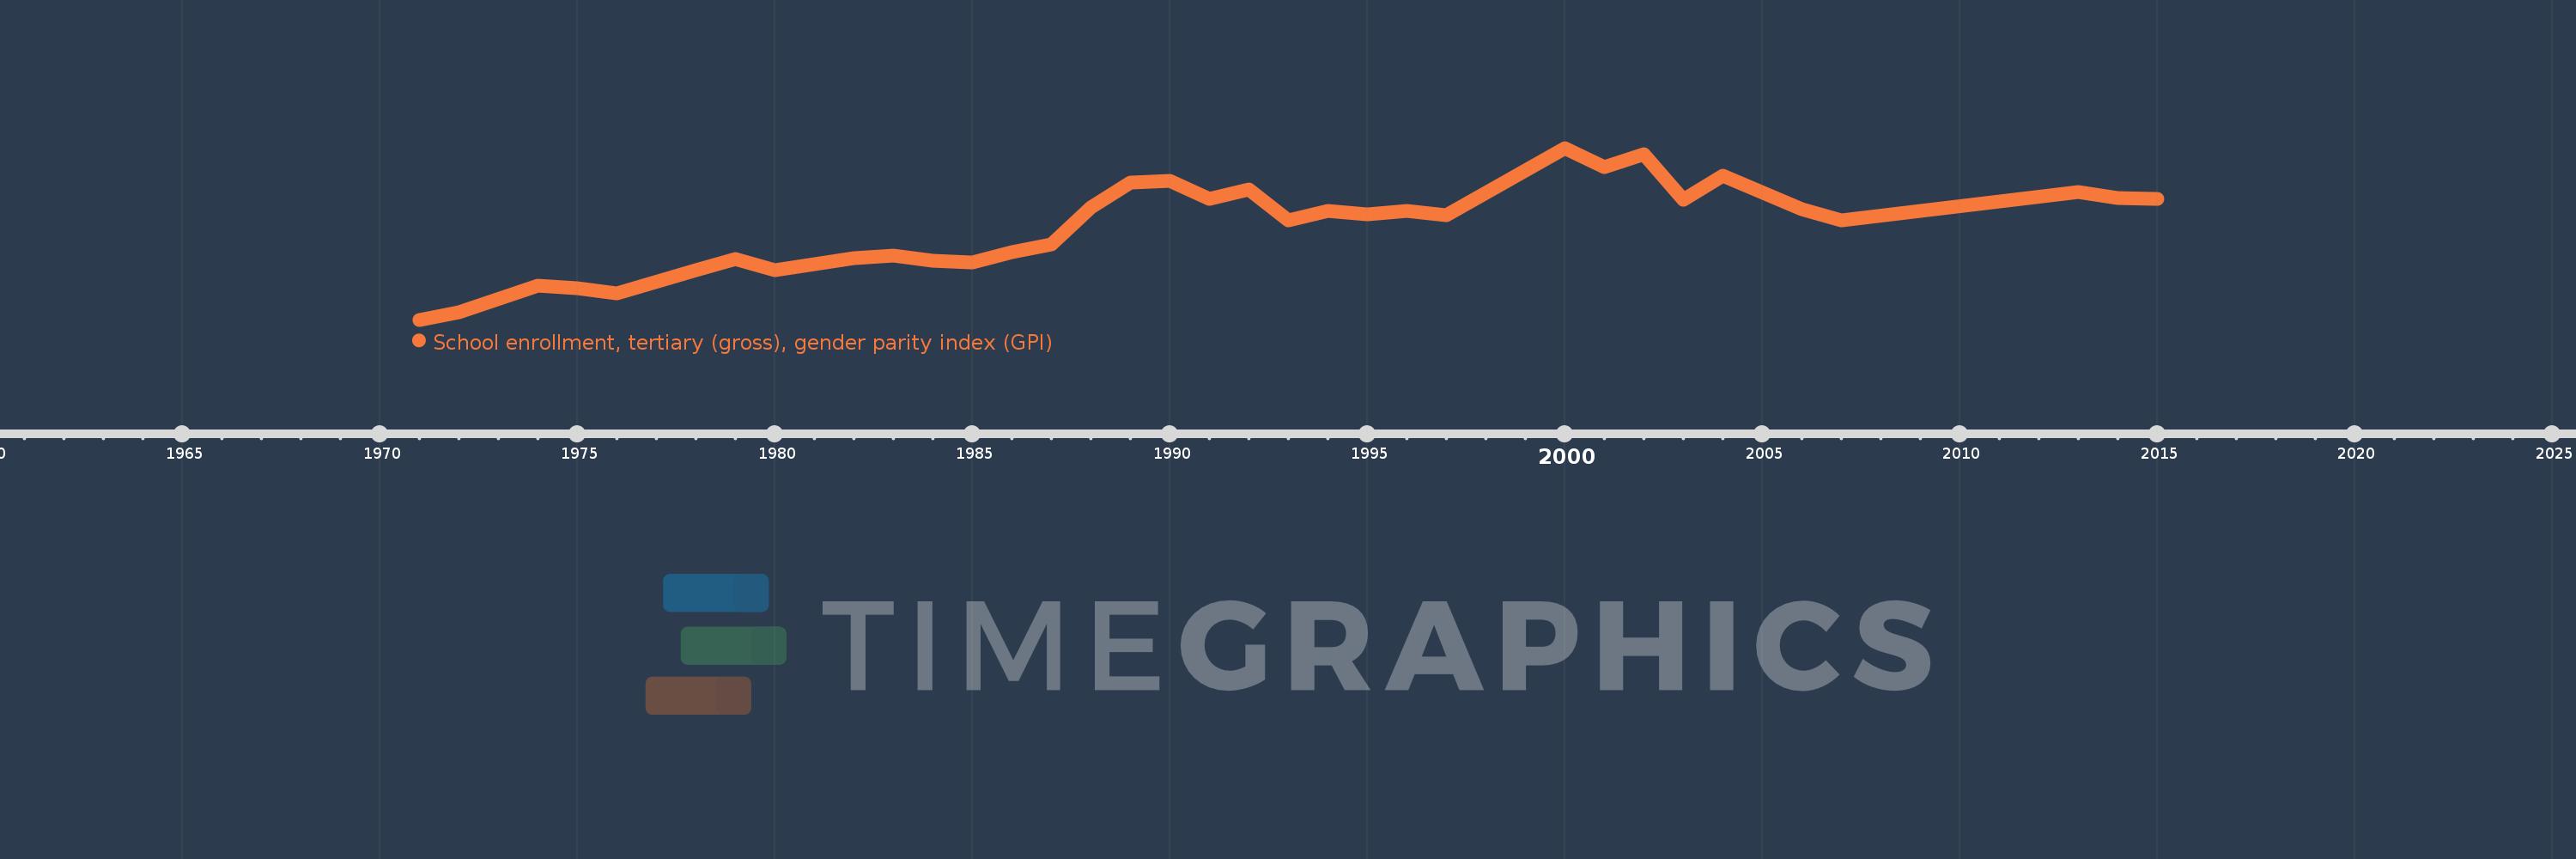
School enrollment, tertiary (gross), gender parity index (GPI)
2015,2014,2013,2007,2006,2004,2003,2002,2001,2000,1997,1996,1995,1994,1993,1992,1991,1990,1989,1988,1987,1986,1985,1984,1983,1982,1980,1979,1978,1976,1975,1974,1972,1971
This statistics in other country:
AfghanistanAlbaniaAlgeriaAngolaAntigua and BarbudaArab WorldArgentinaArmeniaArubaAustraliaAustriaAzerbaijanBahamas, TheBahrainBangladeshBarbadosBelarusBelgiumBelizeBeninBermudaBhutanBoliviaBosnia and HerzegovinaBotswanaBrazilBrunei DarussalamBulgariaBurkina FasoBurundiCabo VerdeCambodiaCameroonCanadaCaribbean small statesCentral African RepublicCentral Europe and the BalticsChadChileChinaColombiaComorosCongo, Dem. Rep.Congo, Rep.Costa RicaCote d'IvoireCroatiaCubaCuracaoCyprusCzech RepublicDenmarkDjiboutiDominicaDominican RepublicEarly-demographic dividendEast Asia & PacificEast Asia & Pacific (excluding high income)East Asia & Pacific (IDA & IBRD countries)EcuadorEgypt, Arab Rep.El SalvadorEquatorial GuineaEritreaEstoniaEthiopiaEuro areaEurope & Central AsiaEurope & Central Asia (excluding high income)Europe & Central Asia (IDA & IBRD countries)European UnionFijiFinlandFragile and conflict affected situationsFranceGabonGambia, TheGeorgiaGermanyGhanaGreeceGrenadaGuatemalaGuineaGuinea-BissauGuyanaHaitiHeavily indebted poor countries (HIPC)High incomeHondurasHong Kong SAR, ChinaHungaryIBRD onlyIcelandIDA & IBRD totalIDA blendIDA onlyIDA totalIndiaIndonesiaIran, Islamic Rep.IraqIrelandIsraelItalyJamaicaJapanJordanKazakhstanKenyaKorea, Dem. People’s Rep.Korea, Rep.KuwaitKyrgyz RepublicLao PDRLate-demographic dividendLatin America & Caribbean Latin America & Caribbean (excluding high income)Latin America & the Caribbean (IDA & IBRD countries)LatviaLeast developed countries: UN classificationLebanonLesothoLiberiaLibyaLiechtensteinLithuaniaLow & middle incomeLow incomeLower middle incomeLuxembourgMacao SAR, ChinaMacedonia, FYRMadagascarMalawiMaldivesMaliMaltaMarshall IslandsMauritaniaMauritiusMexicoMicronesia, Fed. Sts.Middle East & North AfricaMiddle East & North Africa (excluding high income)Middle East & North Africa (IDA & IBRD countries)Middle incomeMoldovaMongoliaMontenegroMoroccoMozambiqueMyanmarNamibiaNepalNetherlandsNew ZealandNicaraguaNigerNigeriaNorth AmericaNorwayOECD membersOmanOther small statesPacific island small statesPakistanPalauPanamaPapua New GuineaParaguayPeruPhilippinesPolandPortugalPost-demographic dividendPre-demographic dividendPuerto RicoQatarRomaniaRussian FederationRwandaSamoaSan MarinoSao Tome and PrincipeSaudi ArabiaSenegalSerbiaSeychellesSierra LeoneSingaporeSlovak RepublicSloveniaSmall statesSomaliaSouth AfricaSouth AsiaSouth Asia (IDA & IBRD)SpainSri LankaSt. Kitts and NevisSt. LuciaSt. Vincent and the GrenadinesSub-Saharan Africa Sub-Saharan Africa (excluding high income)Sub-Saharan Africa (IDA & IBRD countries)SudanSurinameSwazilandSwedenSwitzerlandSyrian Arab RepublicTajikistanTanzaniaThailandTimor-LesteTogoTongaTrinidad and TobagoTunisiaTurkeyTurkmenistanUgandaUkraineUnited Arab EmiratesUnited KingdomUnited StatesUpper middle incomeUruguayUzbekistanVanuatuVenezuela, RBVietnamWest Bank and GazaWorldYemen, Rep.ZambiaZimbabwe Timeline:
This timeline shows a graph from 1971 to 2015 of Lesotho. No data until 1970. Number of actual observations by date: 34.
Source name:
World Development Indicators
Source organization:
United Nations Educational, Scientific, and Cultural Organization (UNESCO) Institute for Statistics.
Categories, topics:
Education, Gender, Social Development
Last updated:
apr 23, 2017
Indicators value changes by year
At the date of observation
Value
Absolute change
Change from previous value
jan 1, 1971
0.445
+0.445
0.0%
jan 1, 1972
0.508
+0.063
14.05%
jan 1, 1974
0.732
+0.224
44.13%
jan 1, 1975
0.707
-0.025
-3.41%
jan 1, 1976
0.663
-0.044
-6.23%
jan 1, 1978
0.857
+0.194
29.31%
jan 1, 1979
0.951
+0.094
10.98%
jan 1, 1980
0.859
-0.092
-9.64%
jan 1, 1982
0.957
+0.098
11.41%
jan 1, 1983
0.984
+0.027
2.81%
jan 1, 1984
0.939
-0.046
-4.63%
jan 1, 1985
0.921
-0.017
-1.82%
jan 1, 1986
1.008
+0.087
9.4%
jan 1, 1987
1.075
+0.067
6.64%
jan 1, 1988
1.379
+0.304
28.26%
jan 1, 1989
1.588
+0.209
15.15%
jan 1, 1990
1.606
+0.018
1.13%
jan 1, 1991
1.453
-0.153
-9.5%
jan 1, 1992
1.533
+0.08
5.51%
jan 1, 1993
1.277
-0.256
-16.7%
jan 1, 1994
1.35
+0.073
5.7%
jan 1, 1995
1.327
-0.023
-1.7%
jan 1, 1996
1.353
+0.026
1.98%
jan 1, 1997
1.316
-0.037
-2.73%
jan 1, 2000
1.879
+0.562
42.72%
jan 1, 2001
1.717
-0.162
-8.64%
jan 1, 2002
1.83
+0.113
6.61%
jan 1, 2003
1.447
-0.383
-20.96%
jan 1, 2004
1.648
+0.202
13.95%
jan 1, 2006
1.365
-0.283
-17.17%
jan 1, 2007
1.275
-0.091
-6.64%
jan 1, 2013
1.511
+0.236
18.52%
jan 1, 2014
1.461
-0.05
-3.29%
jan 1, 2015
1.453
-0.008
-0.52%
Ranking of countries by current statistics by years


Comments: