29
/
en
AIzaSyAYiBZKx7MnpbEhh9jyipgxe19OcubqV5w
April 1, 2024
125511
Egypt, Arab Rep.
EGY
true
2
1
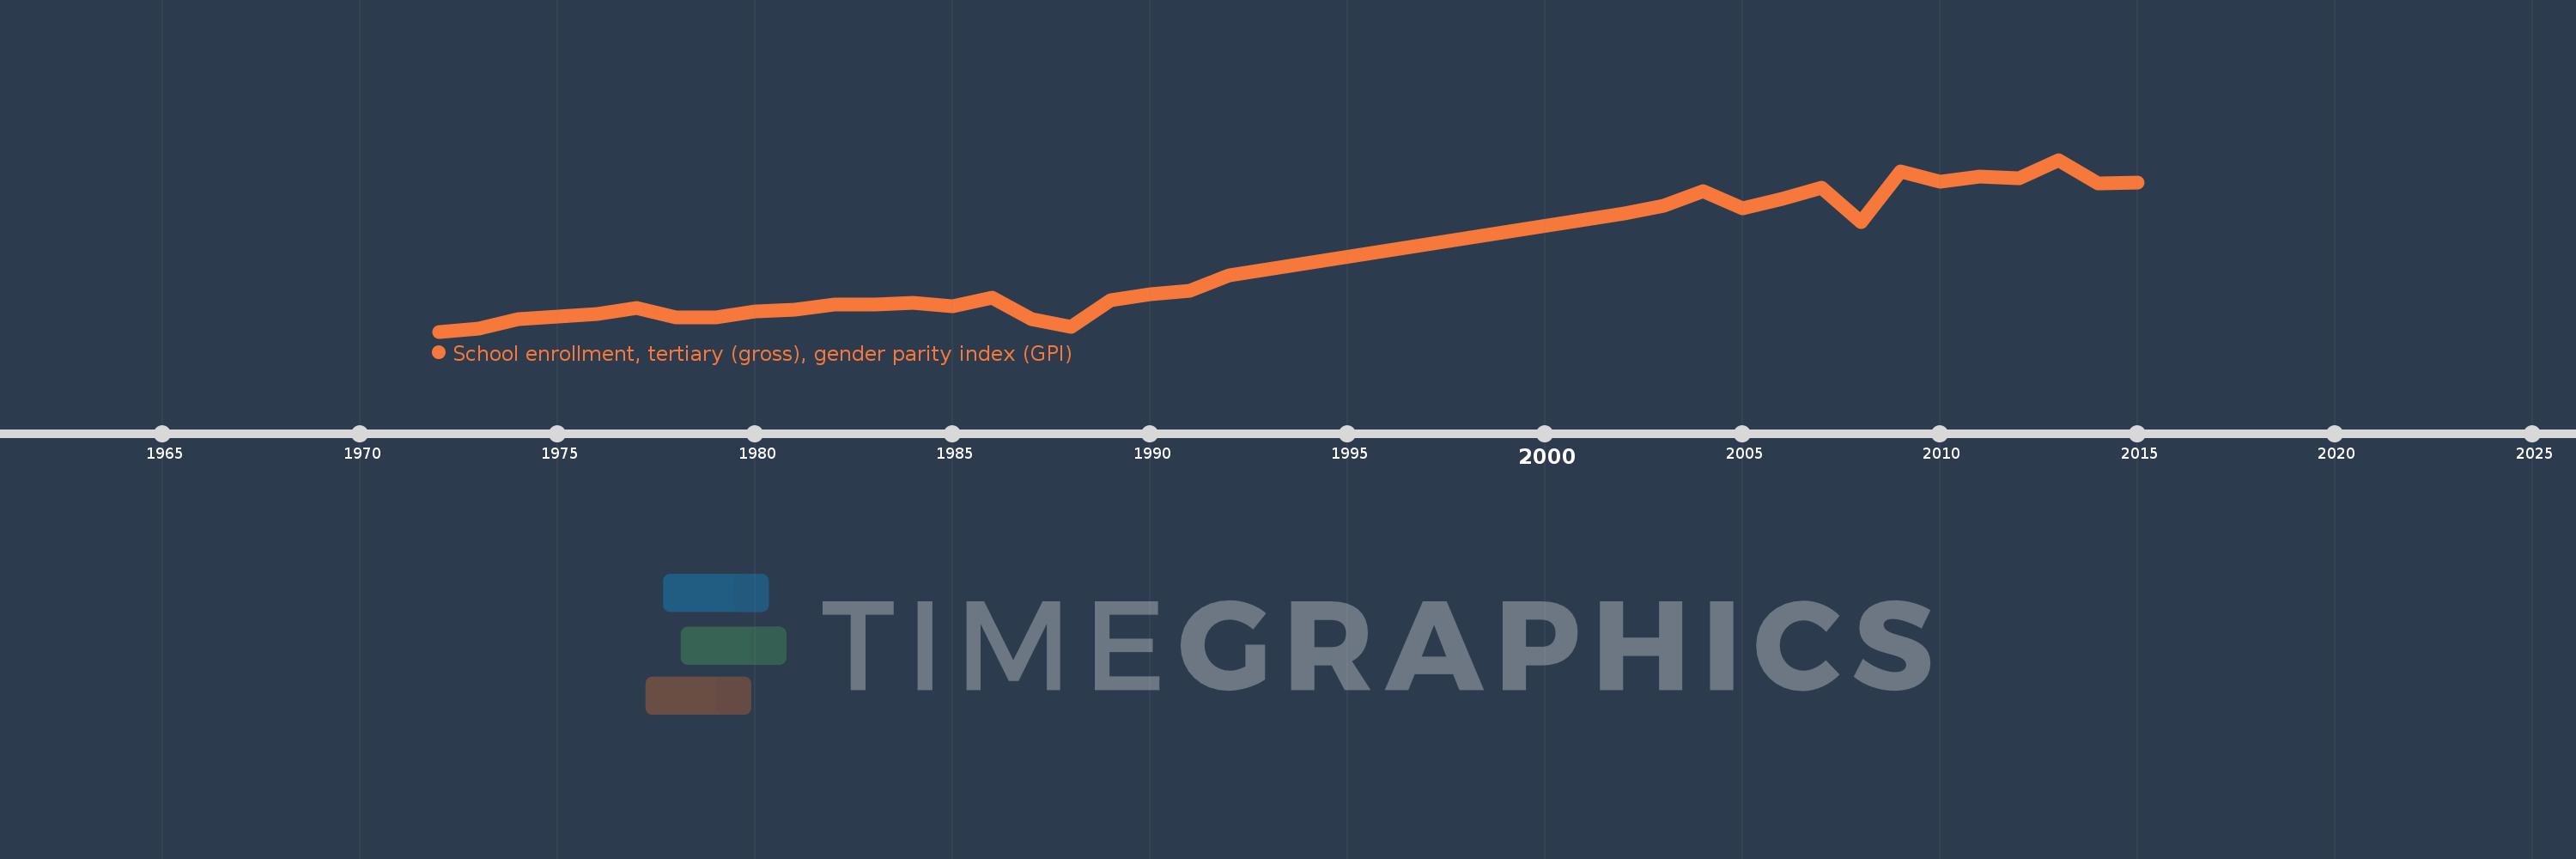
School enrollment, tertiary (gross), gender parity index (GPI)
2015,2014,2013,2012,2011,2010,2009,2008,2007,2006,2005,2004,2003,2002,1992,1991,1990,1989,1988,1987,1986,1985,1984,1983,1982,1981,1980,1979,1978,1977,1976,1975,1974,1973,1972
This statistics in other country:
AfghanistanAlbaniaAlgeriaAngolaAntigua and BarbudaArab WorldArgentinaArmeniaArubaAustraliaAustriaAzerbaijanBahamas, TheBahrainBangladeshBarbadosBelarusBelgiumBelizeBeninBermudaBhutanBoliviaBosnia and HerzegovinaBotswanaBrazilBrunei DarussalamBulgariaBurkina FasoBurundiCabo VerdeCambodiaCameroonCanadaCaribbean small statesCentral African RepublicCentral Europe and the BalticsChadChileChinaColombiaComorosCongo, Dem. Rep.Congo, Rep.Costa RicaCote d'IvoireCroatiaCubaCuracaoCyprusCzech RepublicDenmarkDjiboutiDominicaDominican RepublicEarly-demographic dividendEast Asia & PacificEast Asia & Pacific (excluding high income)East Asia & Pacific (IDA & IBRD countries)EcuadorEgypt, Arab Rep.El SalvadorEquatorial GuineaEritreaEstoniaEthiopiaEuro areaEurope & Central AsiaEurope & Central Asia (excluding high income)Europe & Central Asia (IDA & IBRD countries)European UnionFijiFinlandFragile and conflict affected situationsFranceGabonGambia, TheGeorgiaGermanyGhanaGreeceGrenadaGuatemalaGuineaGuinea-BissauGuyanaHaitiHeavily indebted poor countries (HIPC)High incomeHondurasHong Kong SAR, ChinaHungaryIBRD onlyIcelandIDA & IBRD totalIDA blendIDA onlyIDA totalIndiaIndonesiaIran, Islamic Rep.IraqIrelandIsraelItalyJamaicaJapanJordanKazakhstanKenyaKorea, Dem. People’s Rep.Korea, Rep.KuwaitKyrgyz RepublicLao PDRLate-demographic dividendLatin America & Caribbean Latin America & Caribbean (excluding high income)Latin America & the Caribbean (IDA & IBRD countries)LatviaLeast developed countries: UN classificationLebanonLesothoLiberiaLibyaLiechtensteinLithuaniaLow & middle incomeLow incomeLower middle incomeLuxembourgMacao SAR, ChinaMacedonia, FYRMadagascarMalawiMaldivesMaliMaltaMarshall IslandsMauritaniaMauritiusMexicoMicronesia, Fed. Sts.Middle East & North AfricaMiddle East & North Africa (excluding high income)Middle East & North Africa (IDA & IBRD countries)Middle incomeMoldovaMongoliaMontenegroMoroccoMozambiqueMyanmarNamibiaNepalNetherlandsNew ZealandNicaraguaNigerNigeriaNorth AmericaNorwayOECD membersOmanOther small statesPacific island small statesPakistanPalauPanamaPapua New GuineaParaguayPeruPhilippinesPolandPortugalPost-demographic dividendPre-demographic dividendPuerto RicoQatarRomaniaRussian FederationRwandaSamoaSan MarinoSao Tome and PrincipeSaudi ArabiaSenegalSerbiaSeychellesSierra LeoneSingaporeSlovak RepublicSloveniaSmall statesSomaliaSouth AfricaSouth AsiaSouth Asia (IDA & IBRD)SpainSri LankaSt. Kitts and NevisSt. LuciaSt. Vincent and the GrenadinesSub-Saharan Africa Sub-Saharan Africa (excluding high income)Sub-Saharan Africa (IDA & IBRD countries)SudanSurinameSwazilandSwedenSwitzerlandSyrian Arab RepublicTajikistanTanzaniaThailandTimor-LesteTogoTongaTrinidad and TobagoTunisiaTurkeyTurkmenistanUgandaUkraineUnited Arab EmiratesUnited KingdomUnited StatesUpper middle incomeUruguayUzbekistanVanuatuVenezuela, RBVietnamWest Bank and GazaWorldYemen, Rep.ZambiaZimbabwe Timeline:
This timeline shows a graph from 1972 to 2015 of Egypt, Arab Rep.. No data until 1971. Number of actual observations by date: 35.
Source name:
World Development Indicators
Source organization:
United Nations Educational, Scientific, and Cultural Organization (UNESCO) Institute for Statistics.
Categories, topics:
Education, Gender, Social Development
Last updated:
apr 23, 2017
Indicators value changes by year
At the date of observation
Value
Absolute change
Change from previous value
jan 1, 1972
0.392
+0.392
0.0%
jan 1, 1973
0.402
+0.011
2.78%
jan 1, 1974
0.433
+0.03
7.55%
jan 1, 1975
0.442
+0.009
2.14%
jan 1, 1976
0.451
+0.009
2.12%
jan 1, 1977
0.471
+0.02
4.33%
jan 1, 1978
0.439
-0.032
-6.87%
jan 1, 1979
0.441
+0.002
0.55%
jan 1, 1980
0.46
+0.019
4.31%
jan 1, 1981
0.467
+0.007
1.59%
jan 1, 1982
0.483
+0.015
3.22%
jan 1, 1983
0.484
+0.001
0.25%
jan 1, 1984
0.488
+0.005
0.94%
jan 1, 1985
0.479
-0.01
-1.99%
jan 1, 1986
0.508
+0.03
6.24%
jan 1, 1987
0.433
-0.075
-14.78%
jan 1, 1988
0.409
-0.024
-5.61%
jan 1, 1989
0.499
+0.09
22.04%
jan 1, 1990
0.517
+0.017
3.5%
jan 1, 1991
0.531
+0.015
2.88%
jan 1, 1992
0.583
+0.051
9.64%
jan 1, 2002
0.791
+0.208
35.78%
jan 1, 2003
0.817
+0.026
3.26%
jan 1, 2004
0.868
+0.051
6.27%
jan 1, 2005
0.809
-0.059
-6.77%
jan 1, 2006
0.841
+0.032
3.94%
jan 1, 2007
0.88
+0.038
4.57%
jan 1, 2008
0.763
-0.116
-13.21%
jan 1, 2009
0.933
+0.17
22.25%
jan 1, 2010
0.899
-0.035
-3.7%
jan 1, 2011
0.916
+0.017
1.93%
jan 1, 2012
0.91
-0.006
-0.68%
jan 1, 2013
0.973
+0.063
6.96%
jan 1, 2014
0.894
-0.079
-8.1%
jan 1, 2015
0.897
+0.002
0.24%
Ranking of countries by current statistics by years


Comments: